| Issue |
A&A
Volume 564, April 2014
|
|
|---|---|---|
| Article Number | L12 | |
| Number of page(s) | 5 | |
| Section | Letters | |
| DOI | https://doi.org/10.1051/0004-6361/201423699 | |
| Published online | 09 April 2014 | |
The zCOSMOS redshift survey: evolution of the light in bulges and discs since z ~ 0.8⋆
1 Aix-Marseille Université, CNRS, LAM (Laboratoire d’Astrophysique de Marseille) UMR 7326, 13388 Marseille, France
e-mail: This email address is being protected from spambots. You need JavaScript enabled to view it.
2 Institute of Astronomy, ETH Zurich, 8093 Zurich, Switzerland
3 INAF Osservatorio Astronomico di Bologna, via Ranzani 1, 40127 Bologna, Italy
4 Centro de Estudios de Física del Cosmos de Aragón, plaza San Juan 1, planta 2, 44001 Teruel, Spain
5 Kavli Institute for Astronomy and Astrophysics, Peking University, 100871 Beijing, PR China
6 The Observatories of the Carnegie Institution for Science, 813 Santa Barbara street, Pasadena CA 91101, USA
7 University of Sussex, Falmer, Brighton BN1 9QH, UK
8 INAF Osservatorio Astronomico di Brera, via Brera 28, 20121 Milano, Italy
9 Space Telescope Science Institute, 3700 San Martin Drive, Baltimore MD 21218, USA
10 Astrophysical Observatory, City University of New York, College of Staten Island, 2800 Victory Blvd, Staten Island NY 10314, USA
11 Institute for Computational Cosmology, Durham University, South Road, Durham, UK
12 INAF – Osservatorio Astronomico di Padova, Padova, Italy
13 Research Center for Space and Cosmic Evolution, Ehime University, Bunkyo-cho, 790-8577 Matsuyama, Japan
14 Department of Physiscs, Oxford University, Denis Wilkinson Building, Keble Road, Oxford OX1 3RH, UK
15 Institut de Recherche en Astrophysique et Planétologie, CNRS, 14 avenue Edouard Belin, 31400 Toulouse, France
16 IRAP, Université de Toulouse, UPS-OMP, 31400 Toulouse, France
17 LASTRO, Ecole polytechnique fédérale de Lausanne, 1015 Lausane, Suisse
18 European Southern Observatory, Karl-Schwarzschild-Strasse 2, 85748 Garching, Germany
19 INAF – IASF, via Bassini 15, 20133 Milano, Italy
20 Max – Planck – Institut für extraterrestrische Physik, Giessenbachstrasse, 85748 Garching bei Munchen, Germany
21 Kapteyn Astronomical Institute, University of Groningen, PO Box 800, 9700 AV Groningen, The Netherlands
22 Instituto de Astrofísica de Andalucía, CSIC, Apartado de correos 3004, 18080 Granada, Spain
23 Department of Physics and Astronomy, University of California, Los Angeles CA 90095-1547, USA
24 National Astronomical Observatory of Japan, 2-21-1 Osawa, Mitaka, 181-8588 Tokyo, Japan
25 INAF – IASF Bologna, via P. Gobetti 101, 40129 Bologna, Italy
26 Dipartimento di Astronomia, Università degli Studi di Bologna, 40126 Bologna, Italy
27 Institut d’Astrophysique de Paris, UMR 7095 CNRS, Université Pierre et Marie Curie, 98 bis boulevard Arago, 75014 Paris, France
28 Institute for Astronomy, 2680 Woodlawn Drive, Honolulu HI 96822-1839, USA
29 North America ALMA Science Center, National Radio Astronomy Observatory, USA
Received: 23 February 2014
Accepted: 13 March 2014
Abstract
We studied the chronology of galactic bulge and disc formation by analysing the relative contributions of these components to the B-band rest-frame luminosity density at different epochs. We present the first estimate of the evolution of the fraction of rest-frame B-band light in galactic bulges and discs since redshift z ~ 0.8. We performed a bulge-to-disc decomposition of HST/ACS images of 3266 galaxies in the zCOSMOS-bright survey with spectroscopic redshifts in the range 0.7 ≤ z ≤ 0.9. We find that the fraction of B-band light in bulges and discs is (26 ± 4)% and (74 ± 4)%, respectively. When compared with rest-frame B-band measurements of galaxies in the local Universe in the same mass range ( ), we find that the B-band light in discs decreases by ~30% from z ~ 0.7−0.9 to z ~ 0, while the light from the bulge increases by ~30% over the same period of time. We interpret this evolution as the consequence of star formation and mass assembly processes, as well as morphological transformation, which gradually shift stars formed at half the age of the Universe from star-forming late-type/irregular galaxies to earlier types and ultimately into spheroids.
Key words: galaxies: bulges / galaxies: evolution / galaxies: luminosity function, mass function / galaxies: distances and redshifts / galaxies: fundamental parameters
Based on observations obtained at the European Southern Observatory (ESO) Very Large Telescope (VLT), Paranal, Chile, as part of the Large Program 175.A-0839 (the zCOSMOS Spectroscopic Redshift Survey).
© ESO, 2014
1. Introduction
Several physical processes are at work to assemble mass and shape galaxies during cosmic time, but their relative contributions and effective time-scales are as yet unclear. In the hierarchical dark-matter halo assembly picture, galaxies obtain their baryonic mass through different processes that include major and minor mergers or continuous gas accretion, and lose mass when subject to strong feedback from supernovae and/or AGN (e.g Cattaneo et al. 2006; Croton 2006; Somerville et al. 2008; Benson & Bower 2010). While mergers are directly observed to act on galaxies, their numbers and associated star formation seem to remain insufficient to sustain the high star formation rate observed at the peak in the star formation history. Cold gas accretion fueling star formation has therefore been proposed (Kereš et al. 2005; Sancisi et al. 2008; Dekel et al. 2009; Carilli et al. 2010), but the extent of this process is yet to be confirmed from direct observational evidence (Bouché et al. 2013). The strong decrease in the star formation rate (SFR) density since z ~ 1 (e.g., Lilly et al. 1996; Madau et al. 1996; Tresse et al. 2007; Bouwens et al. 2011; Cucciati et al. 2012) calls for an active process to quench the star formation. While its origin is still unknown, it might be produced either by mass-dependant internal processes or be related to the environments in which galaxies reside.
Each physical process that builds galaxies during cosmic time is expected to leave specific observational signatures, even if simulations cannot reliably predict them. Given this context, it is necessary to seek quantitative galaxy properties that describe how stellar mass has been assembled in the different components of galaxies. A key signature of galaxy evolution is the strong change in the morphological properties, with galaxies evolving from small irregular shapes at early epochs to the well-structured sequence of Hubble types at the present epoch. Because the main components of galaxies today are bulges and discs, it is crucial to trace the onset of these components since early times. The evolution of the luminosity density in galactic bulge and disc components is a powerful method to follow galaxy build-up, which may indicate when and how stars have been transferred into these components. From a subset of the Sloan Digital Sky Survey data Tasca & White (2011) have shown that, averaging over the galaxy population as a whole, (54 ± 2)% of the local cosmic luminosity density comes from discs and (32 ± 2)% from “pure bulge” systems. Of the remaining (14 ± 2)% half comes from the light in the spheroidal component of spiral galaxies and the other half from light in bars of systems with detectable discs.
The COSMOS survey (Scoville et al. 2007b) provides a unique opportunity to make these measurements at about half the age of the Universe by combining high-resolution HST/ACS imaging data (Koekemoer et al. 2007) and accurate spectroscopic redshifts from the zCOSMOS survey (Lilly et al. 2007). In this letter we present for the first time an estimate of the luminosity functions (LF) of galaxy bulges and discs, and the relative contribution of the associated luminosity densities (LD) of these galactic components to the global B-band rest-frame LD at redshift z ~ 0.8. We discuss the evolution of the fraction of B-band light in bulges and discs since z ~ 0.8 as well as the implication for the general picture of galaxy formation and evolution. Throughout this letter we adopt a concordance cosmology with ΩM = 0.27, ΩΛ = 0.73 and H0 = 70 km s-1 Mpc-1. All magnitudes are quoted in the AB system.
2. Observations and data analysis
2.1. Sample
We used the final sample of 20707 objects, the so-called 20k, drawn from the zCOSMOS-bright survey (Lilly et al. 2007), a magnitude-limited spectroscopic redshift survey conducted with the VIMOS instrument on the ESO-VLT (Le Fèvre et al. 2003). These observations cover the full 1.7 deg2 of the COSMOS HST/ACS field (Scoville et al. 2007a), and the pure magnitude selection at IAB < 22.5 yields redshifts in the range 0.1 < z < 1.2.
A detailed redshift-reliability flag system was adopted (see Lilly et al. 2009), and we considered galaxies with high-confidence redshift measurements that translates into a spectroscopic reliability rate of 98.6% and represents approximately 83% of the whole sample. The mean target sampling rate of the 20k sample is about 50% (see Knobel et al. 2012). The target sampling rate of zCOSMOS objects does not depend on the size, brightness, or redshift; a large portion of stars was excluded from the spectroscopic sample based on their photometry and spectral energy distribution (SED).
We added several well-defined criteria to the redshift reliability to select our final sample. Broad-line AGNs and residual stars as well as objects with photometric defects (less than 2%) were removed. We also required morphological information from the modelling of HST/ACS images (see Sect. 2.2). Thus the final sample in this study was reduced by less than ~5%.
To compare the morphological properties of galaxies at different cosmic epochs in the same rest-frame band, one needs to apply a k-correction to each morphological component. This is complicated because of the different SED of the bulge and disc components in a galaxy and the fuzzy mixing of these components. To alleviate this problem, we restricted our analysis to the redshift range 0.7 < z < 0.9, where the observed HST images in the F814W band correspond to the rest-frame B band, in which the z ~ 0.1 study has been performed (Tasca & White 2011). Thus we need no k-correction, which minimised any uncertainty related to the mixing of various stellar populations with different SEDs. The final sample for this study consists of 3266 galaxies. The collection of deep multi-band photometry in the COSMOS field (Taniguchi et al. 2007; Capak et al. 2007; Ilbert et al. 2009; Le Floc’h et al. 2009; McCracken et al. 2010, 2012) enables accurate measurements of B band absolute magnitudes, which were computed following the method described in the appendix of Ilbert et al. (2005).
2.2. Morphological measurements
We derived quantitative morphological parameters for all galaxies in our sample using the high-resolution HST/ACS F814W images with a pixel size of 0.03 arcsec. We measured the bulge-to-total light fractions (B/T) using Gim2D (Simard et al. 2002), a two-dimensional (2D) photometric decomposition algorithm. We fitted each galaxy image to a superposition of an elliptical component with a Sérsic profile for the bulge and a concentric elliptical component with an exponential profile for the disc. The Sérsic index n, defined in Sèrsic (1968), controls the degree of curvature of the profile: a larger n reflects a more centrally concentrated profile. In fitting the bulge component we let 0 < n < 10, while we fix n = 1 for fitting the disc light.
We began with the list of our source positions and used the SExtractor package (Bertin & Arnouts 1996) to perform galaxy photometry in each sub-field to estimate the local sky background level at each point and to define the isophotal area where each object is above the detection threshold. When SExtractor performs galaxy photometry, it constructs a segmentation (or mask) image in which pixels belonging to the same object all have the same value and sky background pixels are flagged by zeros. Our 2D image fit was carried out on all pixels belonging to the same SExtractor-defined object. Like other fitting algorithms, Gim2D needs initial first-guess values to start the computation as well as an assigned specific range for each fitting parameter. We determined these quantities with SExtractor: for each galaxy the photometric value computed by SExtractor (i.e. magnitude, position angle, half-light radius, etc.) was used as initial first-guess quantity; the range qas instead chosen to be the same for all the galaxies and to be wide enough around the mean value of the distribution to allow for the various galaxy types in our sample.
The fitting algorithm then produces values and uncertainties for each model parameter. When Gim2D fits the 2D galaxy surface brightness to compute the galaxy structural parameters it considers not only the pixels assigned to the main galaxy by the mask, but all pixels flagged as object or background in the SExtractor segmentation image. Important information about the galaxy can be contained in the pixels below the detection threshold. The model image of each galaxy is then convolved with a point spread function (see Rhodes et al. 2007) before comparison with the real data.
Two-dimensional bulge-to-disc decomposition of moderately distant galaxies remains a somewhat difficult exercise. Due to the (1 + z)4 surface brightness dimming of cosmological sources, the disc of high-redshift galaxies can be very difficult to detect. Some galaxy structural parameters are hence better determined than others. To alleviate this difficulty we obtained the final galaxy flux by integrating the best-fit model over all pixels, assuring that we did not lose flux in the masked regions. This guarantees that the computation of the integrated bulge and disc luminosities, and as a consequence the B/T parameter, is quite robust. To determine the Gim2D reliability in measuring B/T we ran an extensive set of simulations that uniformly covered the whole range of B/T, galaxy magnitudes, and bulge and disc sizes. The precision of our B/T measurement is 10%. This was taken into account when computing the bulge and disc magnitudes used to derive the corresponding luminosity functons. Systematic errors due to the assignment of isophote twists or axial ratio changes to spurious thin discs were also considered and corrected for in our analysis. Finally, sometimes the fit did not converge or converged to a wrong model as identified from the χ2 and the examination of the residual image after best fit image subtraction. This occurred for fewer than 5% of the galaxies in our sample, and the effect on our results was taken into consideration when we computinged the luminosity functions (LFs).
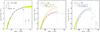 |
Fig. 1 Left panel: global luminosity function in the B-band rest-frame at redshifts 0.7 < z < 0.9. The total number of galaxies used is 3266. The vertical dashed line represents the limit beyond which the STY estimate of the LF becomes incomplete. The STY results for this work over the 20k sample (solid green line and yellow shade, also reported in the two other panels) and for the 10k sample (dashed black line, Zucca et al. 2009) are shown as well as our results for the C+ (squares), SWML (triangles) and 1/Vmax (circles). The shaded region represents the 68% uncertainties of the parameters α and M∗. Central panel: galaxy bulge component (ellipticals + spiral bulges) and pure bulge galaxies (ellipticals) LFs at redshifts 0.7 < z < 0.9 in the B-band rest-frame. 1/Vmax results for galaxy bulges (filled diamonds) and ellipticals (empty diamonds) and the respective 1/Vmax fits (solid and dotted lines). Right panel: galaxy disc component and pure disc galaxies (B/T = 0) LFs at redshifts 0.7 < z < 0.9 in the B-band rest-frame. 1/Vmax results for galaxy discs (filled circles) and irregular galaxies (empty circles) and the respective 1/Vmax fits (solid and dotted lines). |
3. Bulge and disc luminosity functions
The LFs were computed using the algorithm for luminosity function (ALF, Ilbert et al. 2005). We derived the LF in the redshift interval 0.7 < z < 0.9, where the I band corresponds to the B-band rest-frame, to eliminate, or at least to strongly minimise, any uncertainty related to differential k-corrections or to the bias described in Ilbert et al. (2004).
In a standard manner, to take into account unknown redshifts (for unobserved objects and poor-quality spectra), a weight was applied to each galaxy (e.g., Ilbert et al. 2005). This weight is a combination of two different contributions: the target sampling rate (TSR) and the spectroscopic success rate (SSR). Specific to this work, we added to this weighting scheme the morphology success rate (MSR), which is the number of spectroscopic sources with morphological structural parameters successfully measured, as discussed in Sect. 2.2. For each galaxy the associated final weight is given by 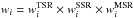 .
.
The total LF at redshifts 0.7 < z < 0.9 is presented in the left panel of Fig. 1. Four different estimators were used and agree down to MB = −20.2, which we took as the limiting magnitude of this study. In particular, our result (with the STY parameters: M∗ = −21.25 ± 0.08, φ∗ = (6.53 ± 0.6)10-3 Mpc-3, and α = −1.11 ± 0.1) is consistent with the previous estimate on the 10k sample (Zucca et al. 2009). The filled points in the central and right panels of Fig. 1 represent the distribution of bulge and disc luminosities derived from the Gim2D fit of galaxies selected with a total luminosity down to IAB = 22.5. The pure-disc luminosity function, represented by open circles in the right panel of Fig. 1, clearly decrease beyond the limiting magnitude of the survey. While down to this magnitude limit both the bulge and the disc LFs are complete, below MB = −20.2 they are lower limits to the real bulge and disc LFs, as shown by the decline in the directly computed disc LF. This effect arises because galaxies fainter than the zCOSMOS survey limit (IAB = 22.5) are, by construction, missing.
We additionally explored the LF of pure bulges (B/T = 1), or ellipticals, for which all the light is in the bulge component, and of pure discs (B/T = 0), or irregular galaxies, for which no bulge is detected. Their LFs are shown in the central and right panels of Fig. 1, where the fit of the Vmax data points are shown for each pure population.
4. Evolution of the B-band rest-frame light since z~ 0.8
Using the LF presented in Sect. 3, we explored for the first time at a median redshift ~0.8 the fraction of B-band light contained in the bulge and disc components of galaxies brigher than IAB = 22.5. We computed the luminosity density (LD) as a simple sum of the 1/Vmax up to MB = −20.2, since we are complete for this population. We find that for galaxies at redshifts 0.7 ≤ z ≤ 0.9, (26 ± 4)% of the B-band luminosity is in bulges, and (74 ± 4)% in discs.
The bulge and disc contributions of galaxies fainter than MB = −20.2 were not investigated. We note that this represents ~5% of their global LD when computed as the sum of 1/Vmax. Since most galaxies fainter than the bias are disc dominated and we observe that the B/T distribution evolves with magnitude towards lower values at lower luminosities, we can therefore speculate that the computed disc LD is a lower limit.
Various studies have computed the LD in bulges and discs in the local Universe using different samples, selections, and methods (e.g., Schechter & Dressler 1987; Benson et al. 2007; Driver et al. 2007; Gadotti 2009; Tasca & White 2011). There is a general agreement that about 50% of the B-band light in the local Universe is contributed by stars in discs.
In Fig. 2 we compare our measurements at z ~ 0.8 with the measurements of Tasca & White (2011) at z ~ 0.1. The fraction of B-band light in discs decreases from (74 ± 4)% to (54 ± 2)%, a ~30% decrease over 6 Gyr. In contrast, the fraction of B-band light in bulges follows a reverse evolution, increasing from (26 ± 4)% to (41 ± 2)% during the same period of time.
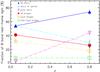 |
Fig. 2 Evolution of the B-band rest-frame light since z ~ 0.8. The local results at a redshift z ~ 0 are taken from Tasca & White (2011). Filled red circles and blue triangles represent the whole B-band rest-frame light in the bulge and disc components. The empty stars and squares stand for the pure bulge and the spheroid populations, while the empty triangles are for bulgeless galaxies and the disc components of spirals. The lines help to guide the eyes. |
The evolution of the fraction of light in different morphological components is a key signature of physical processes that shape galaxies during cosmic time, with the advantage of being a direct observable that does not require any assumption or simulation. Our results indicate that the B-band emissivity has massively shifted from discs to bulges since z ~ 0.8. Furthermore, by splitting the contribution of the bulge light into the luminosity coming from pure bulges, meaning elliptical galaxies, and the luminosity produced by late-type bulges, identified with the central component of spiral galaxies, we are able to follow their different evolution. While elliptical galaxies and the bulges of spirals have been commonly studied as a single population, it is now evident that the stellar populations in these two components follow a distinct evolution, which indicates that different physical processes must be at work. In Fig. 2 it is clearly visible that while the fraction of light in late-type bulges since z ~ 0.8 remains almost constant, the luminosity density in pure bulges increases during the same period from (18 ± 4)% to (32 ± 2)%, determining the global behaviour of the B-band light in the bulge component. We point out that our estimate of the fraction of light in all bulges at ~0.8 is an upper limit because it includes the contribution of bars, which is out of the scope of this paper to study, while the value in the local Universe was computed without the bar contribution, which is separately estimated to be (6 ± 2)% (Tasca & White 2011). The estimate of the fraction of light in the discs of spirals and in the pure discs, meaning bulgeless galaxies, shows that the strong evolution since z ~ 0.8 of the luminosity density in the global disc component is mainly caused by the considerable evolution of bulgeless galaxies.
In late-type galaxies the B-band emissivity is tightly related to the SFR (e.g., Tresse et al. 2002), and therefore traces the on-going instantaneous star formation. The strong diminution of the fraction of B-band light in discs is then connected to the sharp decrease of the star formation rate observed since z ~ 1. In contrast, for bulges the B-band emissivity is mainly dominated by long-lived stars from older stellar populations instead of on-going starburst, and represents an integrated SFR along the time life of the bulge. Thus the galaxy population is decreasing its SFR density within all discs, either via a fading of the stellar population and/or a decrease in number density.
While at z ~ 1 the Hubble sequence is already in place, Tasca et al. (2009) reported a sizeable growth of the fraction of irregular galaxies towards higher redshifts, balanced by the continuous decrease of the elliptical fraction from ~30% at low redshift to ~20% at z ~ 1. The fraction of spiral galaxies instead remains rather constant at ~50%. When this morphological evolution is related to the behaviour of the evolution of the B-band emissivity shown in Fig. 2 we conclude that while for the disc component the fading of the stellar population is not the main factor responsible for the observed trend, an important morphological change is still on-going from z ~ 1 to z ~ 0, mainly driven by the transformation of irregular galaxies and their strong decrease in number density and the consequent increase of the bulge component B-band emissivity.
We emphasise the importance of extending the analysis of bulge and disc components, or their progenitors, to earlier cosmic epochs to obtain better insight into physical processes that drive galaxy formation and evolution. Our results provide an observational reference to test theoretical model predictions. In particular, forming bulgless galaxies have until very recently been a major challenge for hydrodynamical simulations (see Scannapieco et al. 2009; Marinacci et al. 2014); our results provide the reference observed number density for these models to test against.
Acknowledgments
This work is supported by funding from the European Research Council Advanced Grant ERC-2010-AdG-268107-EARLY. We thank CNES and PNC for their financial support of the COSMOS project. This work benefited from the support of the French National Computing Centre (CINES), which provided part of the necessary computational resources. The zCOSMOS & HST-COSMOS survey data used in this work have been obtained from the databases operated by CESAM, Laboratoire d’Astrophysique de Marseille, France.
References
- Benson, A. J., & Bower, R. 2010, MNRAS, 405, 1573 [NASA ADS] [Google Scholar]
- Benson, A. J., Džanović, D., Frenk, C. S., & Sharples, R. 2007, MNRAS, 379, 841 [NASA ADS] [CrossRef] [Google Scholar]
- Bertin, E., & Arnouts, S. 1996, A&AS, 117, 393 [NASA ADS] [CrossRef] [EDP Sciences] [Google Scholar]
- Bouché, N., Murphy, M. T., Kacprzak, G. G., et al. 2013, Science, 341, 50 [NASA ADS] [CrossRef] [Google Scholar]
- Bouwens, R. J., Illingworth, G. D., Oesch, P. A., et al. 2011, ApJ, 737, 90 [NASA ADS] [CrossRef] [Google Scholar]
- Capak, P., Aussel, H., Ajiki, M., et al. 2007, ApJS, 172, 99 [NASA ADS] [CrossRef] [Google Scholar]
- Carilli, C. L., Daddi, E., Riechers, D., et al. 2010, ApJ, 714, 1407 [NASA ADS] [CrossRef] [Google Scholar]
- Cattaneo, A., Dekel, A., Devriendt, J., Guiderdoni, B., & Blaizot, J. 2006, MNRAS, 370, 1651 [NASA ADS] [CrossRef] [Google Scholar]
- Croton, D. J. 2006, MNRAS, 369, 1808 [NASA ADS] [CrossRef] [Google Scholar]
- Cucciati, O., Tresse, L., Ilbert, O., et al. 2012, A&A, 539, A31 [NASA ADS] [CrossRef] [EDP Sciences] [Google Scholar]
- Dekel, A., Birnboim, Y., Engel, G., et al. 2009, Nature, 457, 451 [NASA ADS] [CrossRef] [PubMed] [Google Scholar]
- Driver, S. P., Allen, P. D., Liske, J., & Graham, A. W. 2007, ApJ, 657, L85 [NASA ADS] [CrossRef] [Google Scholar]
- Gadotti, D. A. 2009, MNRAS, 393, 1531 [NASA ADS] [CrossRef] [Google Scholar]
- Ilbert, O., Tresse, L., Arnouts, S., et al. 2004, MNRAS, 351, 541 [NASA ADS] [CrossRef] [Google Scholar]
- Ilbert, O., Tresse, L., Zucca, E., et al. 2005, A&A, 439, 863 [NASA ADS] [CrossRef] [EDP Sciences] [Google Scholar]
- Ilbert, O., Capak, P., Salvato, M., et al. 2009, ApJ, 690, 1236 [NASA ADS] [CrossRef] [Google Scholar]
- Kereš, D., Katz, N., Weinberg, D. H., & Davé, R. 2005, MNRAS, 363, 2 [NASA ADS] [CrossRef] [Google Scholar]
- Knobel, C., Lilly, S. J., Iovino, A., et al. 2012, ApJ, 753, 121 [NASA ADS] [CrossRef] [Google Scholar]
- Koekemoer, A. M., Aussel, H., Calzetti, D., et al. 2007, ApJS, 172, 196 [NASA ADS] [CrossRef] [Google Scholar]
- Le Fèvre, O., Saisse, M., & Mancini, D. 2003, in Proc. SPIE, 4841, eds. M. Iye, & A. F. M. Moorwood, 1670 [Google Scholar]
- Le Floc’h, E., Aussel, H., Ilbert, O., et al. 2009, ApJ, 703, 222 [NASA ADS] [CrossRef] [Google Scholar]
- Lilly, S. J., Le Fèvre, O., Hammer, F., & Crampton, D. 1996, ApJ, 460, L1 [NASA ADS] [CrossRef] [Google Scholar]
- Lilly, S. J., Le Fèvre, O., Renzini, A., & Zamorani, G. 2007, ApJS, 172, 70 [NASA ADS] [CrossRef] [Google Scholar]
- Lilly, S. J., Le Brun, V., Maier, C., et al. 2009, ApJS, 184, 218 [Google Scholar]
- Madau, P., Ferguson, H. C., Dickinson, M. E., et al. 1996, MNRAS, 283, 1388 [NASA ADS] [CrossRef] [Google Scholar]
- Marinacci, F., Pakmor, R., & Springel, V. 2014, MNRAS, 437, 1750 [NASA ADS] [CrossRef] [Google Scholar]
- McCracken, H. J., Capak, P., Salvato, M., et al. 2010, ApJ, 708, 202 [NASA ADS] [CrossRef] [Google Scholar]
- McCracken, H. J., Milvang-Jensen, B., Dunlop, J., et al. 2012, A&A, 544, A156 [NASA ADS] [CrossRef] [EDP Sciences] [Google Scholar]
- Rhodes, J. D., Massey, R. J., Albert, J., et al. 2007, ApJS, 172, 203 [NASA ADS] [CrossRef] [Google Scholar]
- Sancisi, R., Fraternali, F., Oosterloo, T., & van der Hulst, T. 2008, A&ARv, 15, 189 [NASA ADS] [CrossRef] [EDP Sciences] [Google Scholar]
- Scannapieco, C., White, S. D. M., Springel, V., & Tissera, P. B. 2009, MNRAS, 396, 696 [NASA ADS] [CrossRef] [Google Scholar]
- Schechter, P. L., & Dressler, A. 1987, AJ, 94, 563 [NASA ADS] [CrossRef] [Google Scholar]
- Scoville, N., Abraham, R. G., Aussel, H., et al. 2007a, ApJS, 172, 38 [NASA ADS] [CrossRef] [Google Scholar]
- Scoville, N., Aussel, H., Brusa, M., et al. 2007b, ApJS, 172, 1 [NASA ADS] [CrossRef] [Google Scholar]
- Sèrsic, J. L. 1968, Atlas de galaxias australes (Cordoba, Argentina: Observatorio Astronomico) [Google Scholar]
- Simard, L., Willmer, C. N. A., Vogt, N. P., et al. 2002, ApJS, 142, 1 [NASA ADS] [CrossRef] [Google Scholar]
- Somerville, R. S., Hopkins, P. F., Cox, T. J., Robertson, B. E., & Hernquist, L. 2008, MNRAS, 391, 481 [NASA ADS] [CrossRef] [Google Scholar]
- Taniguchi, Y., Scoville, N., Murayama, T., et al. 2007, ApJS, 172, 9 [NASA ADS] [CrossRef] [Google Scholar]
- Tasca, L. A. M., & White, S. D. M. 2011, A&A, 530, A106 [NASA ADS] [CrossRef] [EDP Sciences] [Google Scholar]
- Tasca, L. A. M., Kneib, J.-P., Iovino, A., & Le Fèvre, O. 2009, A&A, 503, 379 [NASA ADS] [CrossRef] [EDP Sciences] [Google Scholar]
- Tresse, L., Maddox, S. J., Le Fèvre, O., & Cuby, J.-G. 2002, MNRAS, 337, 369 [NASA ADS] [CrossRef] [Google Scholar]
- Tresse, L., Ilbert, O., Zucca, E., et al. 2007, A&A, 472, 403 [NASA ADS] [CrossRef] [EDP Sciences] [Google Scholar]
- Zucca, E., Bardelli, S., Bolzonella, M., et al. 2009, A&A, 508, 1217 [NASA ADS] [CrossRef] [EDP Sciences] [Google Scholar]
All Figures
|
Fig. 1 Left panel: global luminosity function in the B-band rest-frame at redshifts 0.7 < z < 0.9. The total number of galaxies used is 3266. The vertical dashed line represents the limit beyond which the STY estimate of the LF becomes incomplete. The STY results for this work over the 20k sample (solid green line and yellow shade, also reported in the two other panels) and for the 10k sample (dashed black line, Zucca et al. 2009) are shown as well as our results for the C+ (squares), SWML (triangles) and 1/Vmax (circles). The shaded region represents the 68% uncertainties of the parameters α and M∗. Central panel: galaxy bulge component (ellipticals + spiral bulges) and pure bulge galaxies (ellipticals) LFs at redshifts 0.7 < z < 0.9 in the B-band rest-frame. 1/Vmax results for galaxy bulges (filled diamonds) and ellipticals (empty diamonds) and the respective 1/Vmax fits (solid and dotted lines). Right panel: galaxy disc component and pure disc galaxies (B/T = 0) LFs at redshifts 0.7 < z < 0.9 in the B-band rest-frame. 1/Vmax results for galaxy discs (filled circles) and irregular galaxies (empty circles) and the respective 1/Vmax fits (solid and dotted lines). |
| In the text | |
|
Fig. 2 Evolution of the B-band rest-frame light since z ~ 0.8. The local results at a redshift z ~ 0 are taken from Tasca & White (2011). Filled red circles and blue triangles represent the whole B-band rest-frame light in the bulge and disc components. The empty stars and squares stand for the pure bulge and the spheroid populations, while the empty triangles are for bulgeless galaxies and the disc components of spirals. The lines help to guide the eyes. |
| In the text | |
Current usage metrics show cumulative count of Article Views (full-text article views including HTML views, PDF and ePub downloads, according to the available data) and Abstracts Views on Vision4Press platform.
Data correspond to usage on the plateform after 2015. The current usage metrics is available 48-96 hours after online publication and is updated daily on week days.
Initial download of the metrics may take a while.