Fig. 1
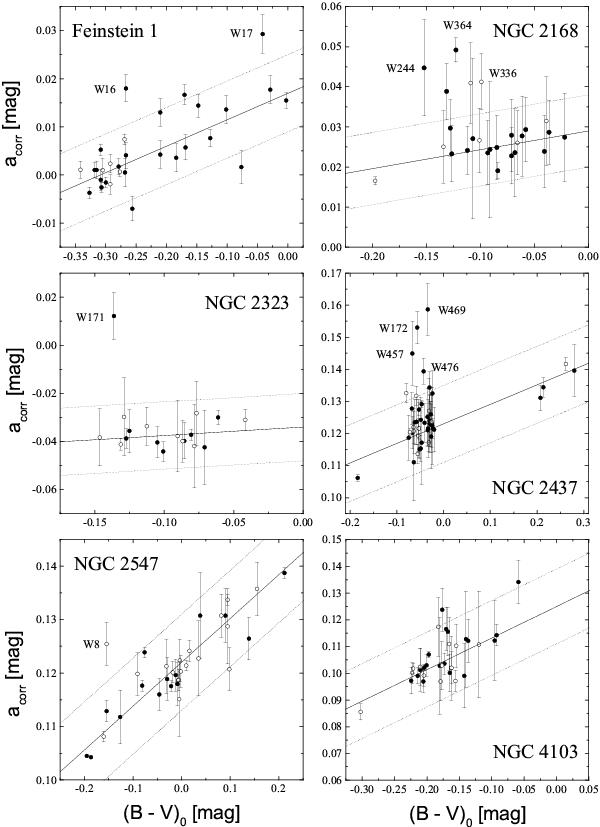
acorr versus (B − V)0 diagrams for target clusters. Filled circles denote stars with a kinematical membership probability of more than 50%, open circles less than 50%. Stars with a statistical significant Δa value, are denoted with their WEBDA numbers (W no.). The solid line is the normality line and the dotted lines are the confidence intervals corresponding to 99.9%.
Current usage metrics show cumulative count of Article Views (full-text article views including HTML views, PDF and ePub downloads, according to the available data) and Abstracts Views on Vision4Press platform.
Data correspond to usage on the plateform after 2015. The current usage metrics is available 48-96 hours after online publication and is updated daily on week days.
Initial download of the metrics may take a while.