Fig. 8
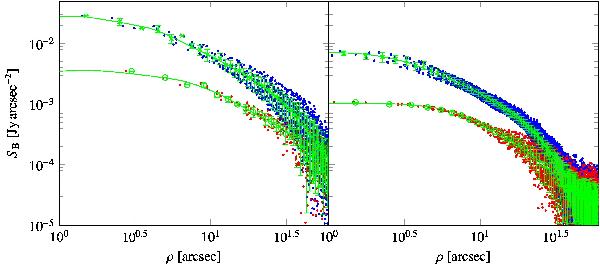
Left panel: surface brightness in comet C/2006 W3 (Christensen) as a function of distance from the position of the center of the peak measured with PACS on UT 1.8 November 2009 (shown by the blue and red dots for the 70 μm and 160 μm bands with a pixel size of 3.̋2 and 6.̋4). Right panel: surface brightness radial profiles observed on UT 26.5 August 2010 (blue and red dots denote the 70 μm and 160 μm bands with projected pixel size of 1′′ and 2′′). The green crosses and circles are resampled profiles with 1′′ and 2′′ bins for the blue and red band images from November 2009, and 0.̋5 and 1′′ bins for the blue and red band images from August 2010. Error bars are 1σ statistical uncertainties.
Current usage metrics show cumulative count of Article Views (full-text article views including HTML views, PDF and ePub downloads, according to the available data) and Abstracts Views on Vision4Press platform.
Data correspond to usage on the plateform after 2015. The current usage metrics is available 48-96 hours after online publication and is updated daily on week days.
Initial download of the metrics may take a while.