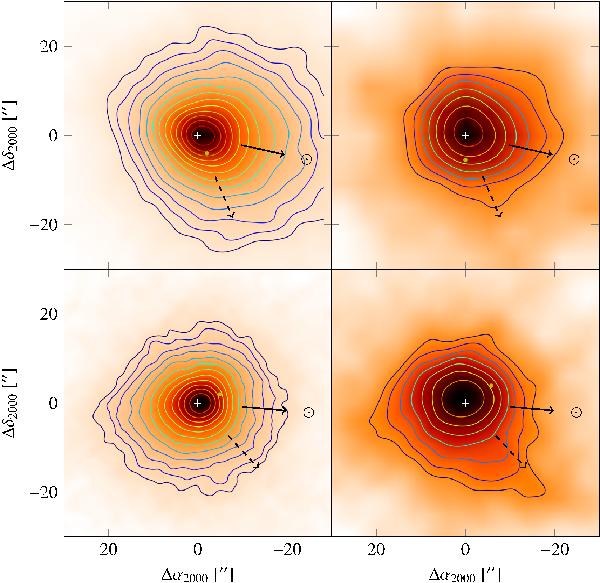
Fig. 7

Maps at 70 μm (blue band; left column) and 160 μm (red band; right column) of comet C/2006 W3 (Christensen) observed with PACS on UT 1.5 November 2009 (upper row, see Paper I) and UT 26.5 August 2010 (bottom row) centered on the peak position indicated by the white cross. The pixel sizes are 3.2′′ in the blue map and 6.4′′ in the red map for the November 2009 observations, and 1′′ in the blue map and 2′′ in the red map for the August 2010 data. Contour levels have a step of 0.1 on logarithmic scale in all the images. The position of the nucleus at the mid-time of the observations according to the HORIZONS ephemeris is shown by the yellow circle. The projected directions toward the Sun and velocity vector of the comet are indicated by the solid and dashed arrows.
Current usage metrics show cumulative count of Article Views (full-text article views including HTML views, PDF and ePub downloads, according to the available data) and Abstracts Views on Vision4Press platform.
Data correspond to usage on the plateform after 2015. The current usage metrics is available 48-96 hours after online publication and is updated daily on week days.
Initial download of the metrics may take a while.


