Fig. 6
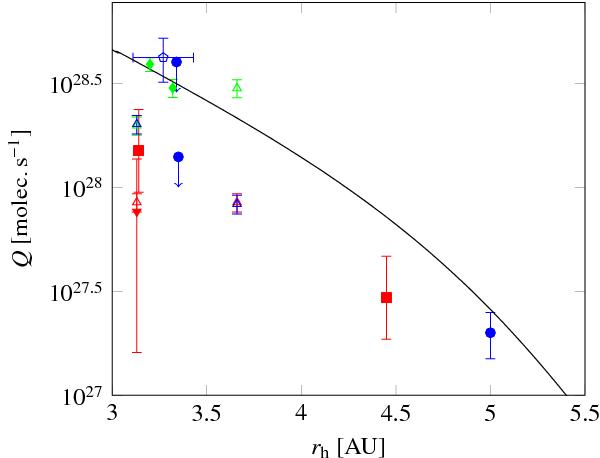
H2O (blue data points), CO2 (red data points) and CO (green data points) production rates in comet C/2006 W3 (Christensen) as a function of heliocentric distance with 1σ uncertainties. Open symbols show pre-perihelion production rates and filled symbols are post-perihelion rates. Circles represent detections by Herschel (Paper I, and this work); triangles are production rates from AKARI (Ootsubo et al. 2012); squares are rates measured by Spitzer (Reach et al. 2013); the inverted triangle is the CO2 production rate computed from from the NCO2/NH2O ratio estimated from the OI forbidden lines measured at the Apache Point Observatory 3.5-m telescope (McKay et al. 2012); diamonds are production rates obtained by the IRAM 30-m telescope, and the pentagon is the QH2O derived from OH observations at Nançay (Paper I). The upper limits to the water production rate at about 3.3 AU were obtained by PACS and SPIRE spectroscopy (Paper I). The solid line is the water production rate by sublimation at the subsolar point on the nucleus.
Current usage metrics show cumulative count of Article Views (full-text article views including HTML views, PDF and ePub downloads, according to the available data) and Abstracts Views on Vision4Press platform.
Data correspond to usage on the plateform after 2015. The current usage metrics is available 48-96 hours after online publication and is updated daily on week days.
Initial download of the metrics may take a while.