Fig. 5
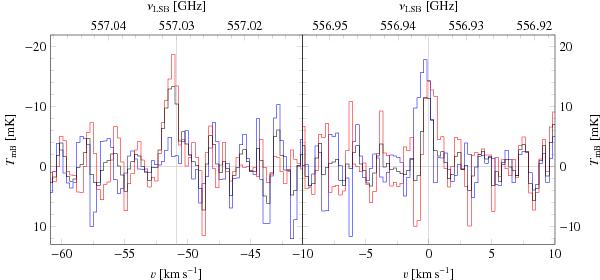
Unfolded level-2 spectra for the horizontal polarization mixer (blue line), vertical polarization mixer (red line), and averaged spectrum (black line) obtained with the WBS on UT 1.5 September 2010. Baselines are fitted with a linear combination of sine functions obtained by masking (−1, 1) km s-1 windows around the expected position of negative (left panel) and positive (right panel) phases of the frequency-switched line rest frequency of the H2O JKaKc (110–101) transition. Note that the scale in the vertical axes is the main brightness temperature corrected by the forward and beam efficiencies (the vertical axis scale is inverted in the left panel). The upper horizontal axis is the lower sideband frequency, and the lower horizontal axis shows the Doppler velocity with respect to the nucleus rest frame.
Current usage metrics show cumulative count of Article Views (full-text article views including HTML views, PDF and ePub downloads, according to the available data) and Abstracts Views on Vision4Press platform.
Data correspond to usage on the plateform after 2015. The current usage metrics is available 48-96 hours after online publication and is updated daily on week days.
Initial download of the metrics may take a while.