Fig. 3
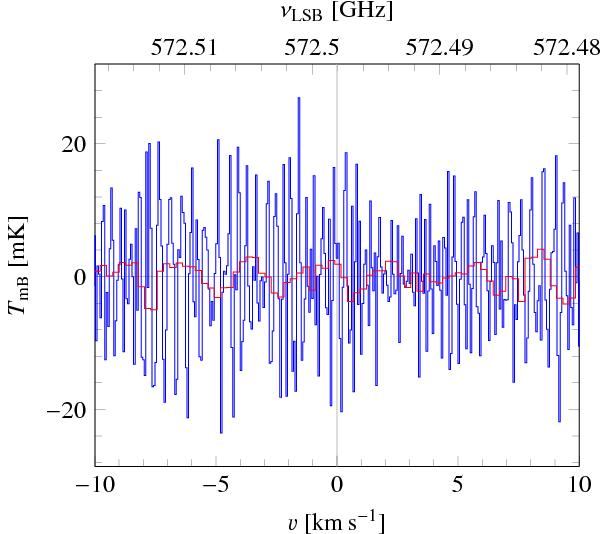
Folded averaged spectra of the JK (10–00) transition of NH3 at 572.498 GHz obtained with the HRS (blue line) and WBS (red line) on UT 1.5 September 2010. The vertical axis is the calibrated main-beam brightness temperature, the upper horizontal axis shows the upper sideband frequency, and the lower horizontal axis shows the Doppler velocity with respect to the nucleus rest frame.
Current usage metrics show cumulative count of Article Views (full-text article views including HTML views, PDF and ePub downloads, according to the available data) and Abstracts Views on Vision4Press platform.
Data correspond to usage on the plateform after 2015. The current usage metrics is available 48-96 hours after online publication and is updated daily on week days.
Initial download of the metrics may take a while.