Free Access
Fig. 7
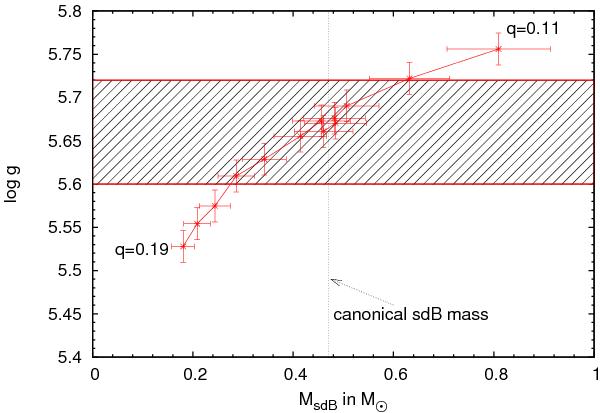
Comparison of the photometric and spectroscopic surface gravity for the solutions with different mass ratio q = 0.11−0.19 (marked by the error cross). The spectroscopic surface gravity with uncertainty is given by the shaded area.
Current usage metrics show cumulative count of Article Views (full-text article views including HTML views, PDF and ePub downloads, according to the available data) and Abstracts Views on Vision4Press platform.
Data correspond to usage on the plateform after 2015. The current usage metrics is available 48-96 hours after online publication and is updated daily on week days.
Initial download of the metrics may take a while.