Fig. 5
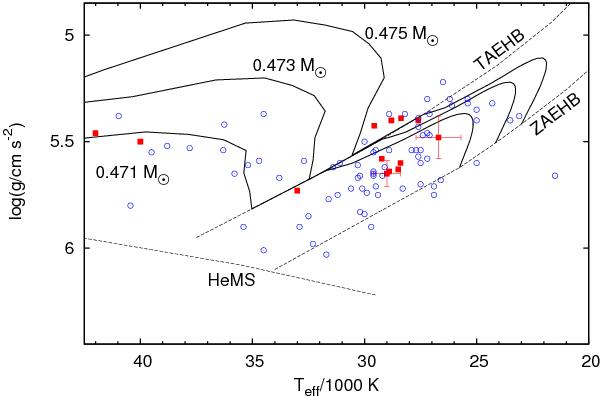
Teff − log g diagram of the HW Vir systems. The solid lines are evolutionary tracks by Dorman et al. (1993) for an sdB mass of 0.471, 0.473, and 0.475 M⊙. The positions of J1622 and J0820 are indicated with crosses. The other squares mark the position of other HW Vir-like systems (Van Grootel et al. 2013a; Drechsel et al. 2001; For et al. 2010; Geier et al. 2011d; Maxted et al. 2002; Klepp & Rauch 2011; Østensen et al. 2008, 2010; Wood & Saffer 1999; Almeida et al. 2012; Barlow et al. 2013). The open dots represent other sdB binaries from the literature.
Current usage metrics show cumulative count of Article Views (full-text article views including HTML views, PDF and ePub downloads, according to the available data) and Abstracts Views on Vision4Press platform.
Data correspond to usage on the plateform after 2015. The current usage metrics is available 48-96 hours after online publication and is updated daily on week days.
Initial download of the metrics may take a while.