Free Access
Fig. 9
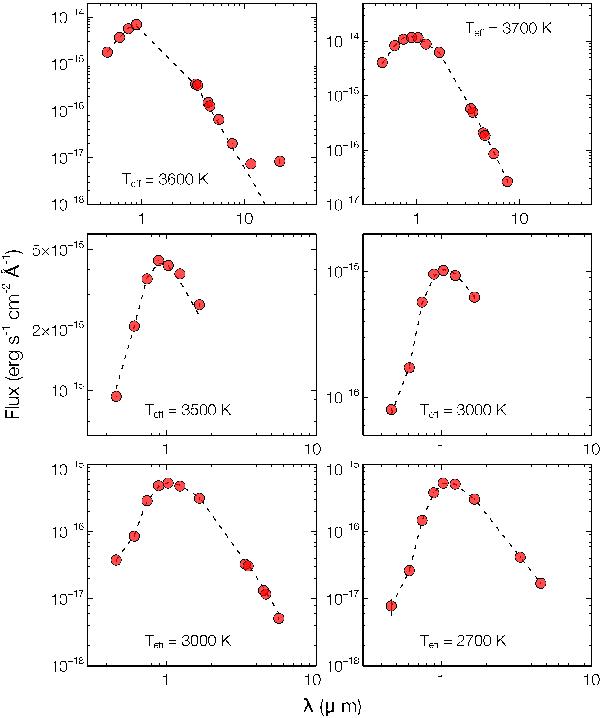
Examples of SED fitting obtained with VOSA. The red dots represent the observed photometry for a random sample of six sources selected as members. The dashed line represents the best-fit BT-Settl model. The corresponding Teff is indicated.
Current usage metrics show cumulative count of Article Views (full-text article views including HTML views, PDF and ePub downloads, according to the available data) and Abstracts Views on Vision4Press platform.
Data correspond to usage on the plateform after 2015. The current usage metrics is available 48-96 hours after online publication and is updated daily on week days.
Initial download of the metrics may take a while.