Fig. 5
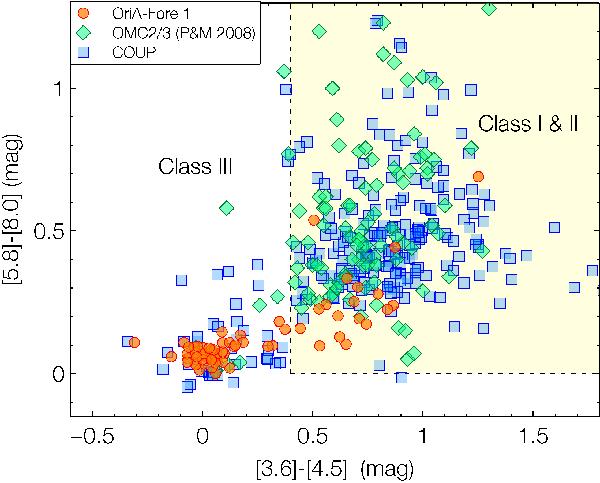
[3.6] – [4.5] vs. [5.8] – [8.0] color–color diagram for OriA-Fore 1 (orange dots, sources located within 20′ of the centroid of the overdensity, see Fig. 4), for known OMC2/3 members from Peterson & Megeath (2008) (green diamonds) and for the sample of ONC members from the COUP survey (blue squares). Dotted lines represent the boundary between class III and class I & II sources (shaded area) as defined in Allen et al. (2004).
Current usage metrics show cumulative count of Article Views (full-text article views including HTML views, PDF and ePub downloads, according to the available data) and Abstracts Views on Vision4Press platform.
Data correspond to usage on the plateform after 2015. The current usage metrics is available 48-96 hours after online publication and is updated daily on week days.
Initial download of the metrics may take a while.