Fig. 12
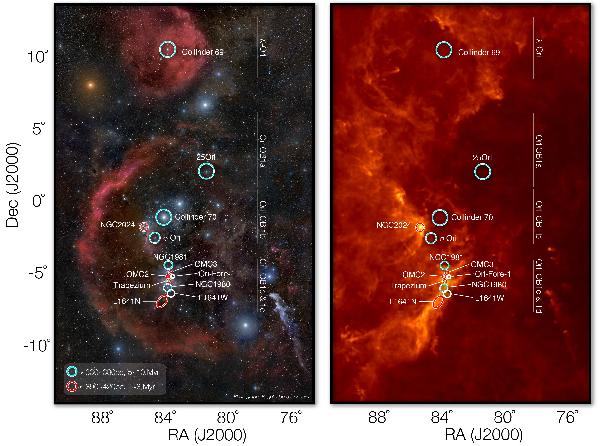
Left panel: distribution of foreground (light blue) and background (red) groups overplotted on an optical photograph of the Orion constellation (courtesy of Rogelio Bernal Andreo – DeepSkyColors.com). Right panel: same as left panel, but overplotted on a far-infrared (850 μm) Planck map. L1641W and OriA-Fore 1 distances are uncertain and are represented as a white circles.
Current usage metrics show cumulative count of Article Views (full-text article views including HTML views, PDF and ePub downloads, according to the available data) and Abstracts Views on Vision4Press platform.
Data correspond to usage on the plateform after 2015. The current usage metrics is available 48-96 hours after online publication and is updated daily on week days.
Initial download of the metrics may take a while.