Fig. 2
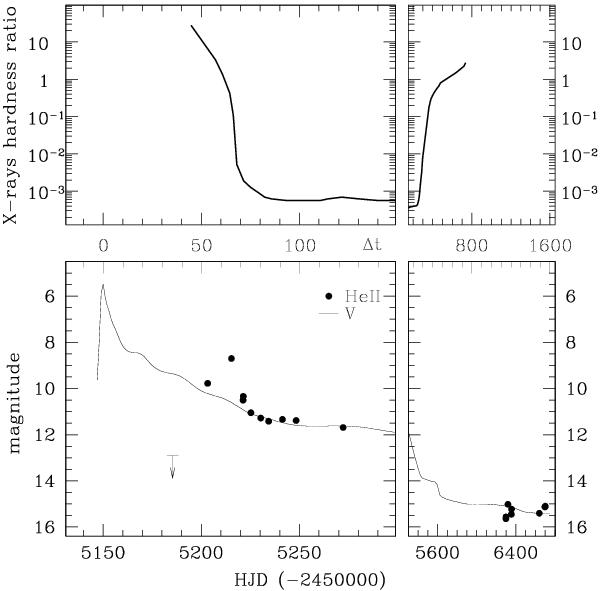
Evolution of the integrated flux of HeII 4686 Å emission line of KT Eri compared to its V-band light curve (from Hounsell et al. 2010, AAVSO database, Munari & Dallaporta 2014, and unpublished recent data). To facilitate the comparison, the integrated line flux is transformed in magnitudes and offset by the quantity given in Eq. (1). The arrow marks the upper limit to HeII integrated flux on day +35 spectra. Top panel: the hardness ratio (defined as the ratio between the count rates in the 1–10 keV and 0.3–1 keV bands) of the Swift X-ray observations (adapted from public data available on the Swift web site).
Current usage metrics show cumulative count of Article Views (full-text article views including HTML views, PDF and ePub downloads, according to the available data) and Abstracts Views on Vision4Press platform.
Data correspond to usage on the plateform after 2015. The current usage metrics is available 48-96 hours after online publication and is updated daily on week days.
Initial download of the metrics may take a while.