Fig. 2
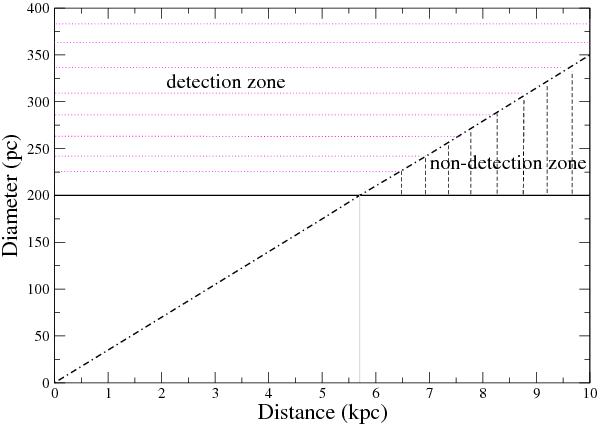
Scheme showing selection effects. The black dashed dotted line shows 2° angular size structures at different distances from the Sun. The full horizontal line represents structures with linear sizes of 200 pc. The gray line at 5.7 kpc from the Sun marks the limit of detection of a 2° structure. The area marked with black dashed lines shows the non-detection region. The area marked with dotted lines shows the detection zone.
Current usage metrics show cumulative count of Article Views (full-text article views including HTML views, PDF and ePub downloads, according to the available data) and Abstracts Views on Vision4Press platform.
Data correspond to usage on the plateform after 2015. The current usage metrics is available 48-96 hours after online publication and is updated daily on week days.
Initial download of the metrics may take a while.