Free Access
Fig. 1
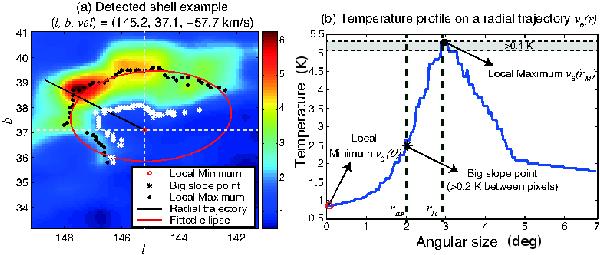
Example of a shell detected on the average of five contiguous velocity channels a) centered at the systemic velocity (− 57.7km s-1), and one corresponding temperature profile (black straight line in a) panel) where the big slope and the local maximum points are identified b).
Current usage metrics show cumulative count of Article Views (full-text article views including HTML views, PDF and ePub downloads, according to the available data) and Abstracts Views on Vision4Press platform.
Data correspond to usage on the plateform after 2015. The current usage metrics is available 48-96 hours after online publication and is updated daily on week days.
Initial download of the metrics may take a while.