Fig. 6
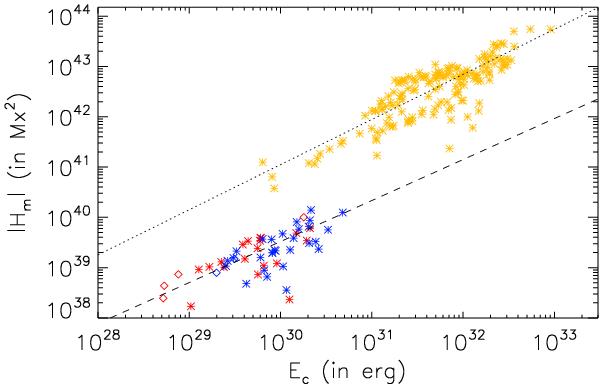
Free magnetic energy – relative helicity diagram of solar quiet regions. Red/blue corresponds to negative/positive total magnetic helicity budgets, while asterisks denote regions centered within heliolatitudes of ±30° and diamonds denote regions centered on higher latitudes. The dashed line denotes the least-squares best fit of Eq. (3). Yellow asterisks show for comparison the free energy – relative helicity diagram of ARs derived by Tziotziou et al. (2012), while the dotted line shows the respective least-squares best fit.
Current usage metrics show cumulative count of Article Views (full-text article views including HTML views, PDF and ePub downloads, according to the available data) and Abstracts Views on Vision4Press platform.
Data correspond to usage on the plateform after 2015. The current usage metrics is available 48-96 hours after online publication and is updated daily on week days.
Initial download of the metrics may take a while.