Fig. 5
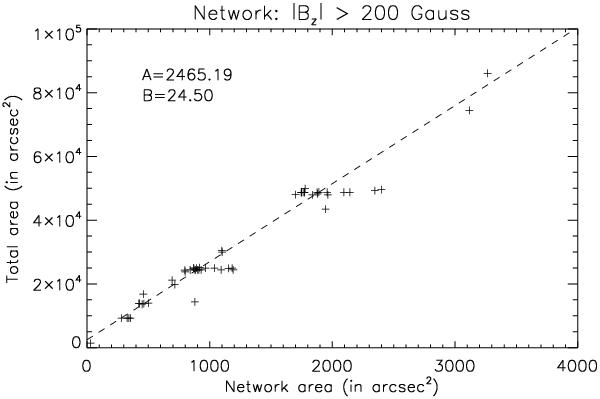
Scatter plot between derived network area and the total area (on the image plane) of the 55 considered quiet-Sun magnetograms for a network threshold of |Bz|> 200 G. The dashed line shows the best linear fit (y = A + Bx) between the network area (x) and the total area (y). A similar linear monotonic dependence holds for the other two network thresholds (100 G, 300 G) considered in this analysis with respective linear fit coefficients (A,B) equal to (2177.41, 11.13) and (3288.36, 37.9). The linear fit coefficients (A,B) between network and total area measured on the heliographic plane for the network thresholds (100 G, 200 G, 300 G) are equal to (2337.97, 11.17), (3569.72, 23.95), and (3463.81, 38.73).
Current usage metrics show cumulative count of Article Views (full-text article views including HTML views, PDF and ePub downloads, according to the available data) and Abstracts Views on Vision4Press platform.
Data correspond to usage on the plateform after 2015. The current usage metrics is available 48-96 hours after online publication and is updated daily on week days.
Initial download of the metrics may take a while.