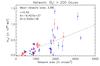
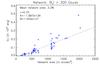
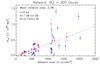
Fig. 4
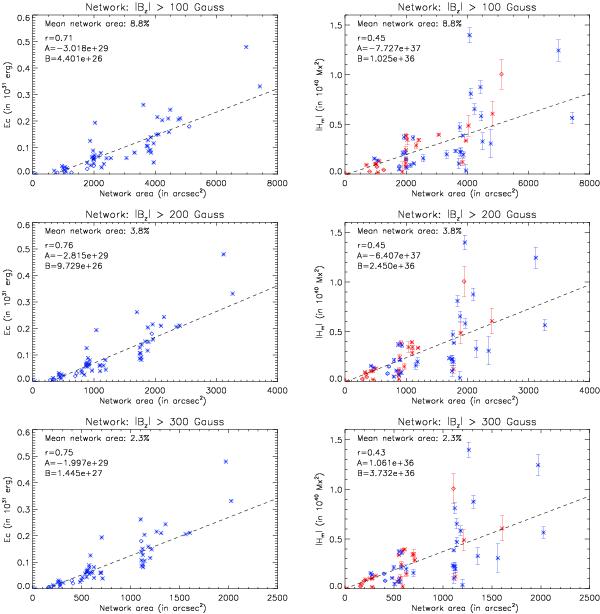
Derived free magnetic energy (left column) and relative magnetic helicity (right column) budgets as a function of the image plane magnetic network area for three different network area thresholds of 100 G, 200 G, and 300 G. In plots involving helicity budgets, red/blue colors correspond to negative/positive magnetic-helicity budgets. Quiet-Sun regions centered within latitudes of ±30° (see Fig. 1) are represented by asterisks, while regions centered on larger latitudes are presented by diamonds. Error bars in helicity are also shown, while respective energy errors are not indicated because of their very small amplitude (~1028 erg). Dashed lines show the best linear fit between helicity/energy and network area (y = A + Bx, where y represents helicity/energy and x the network area). Derived fitting coefficients A and B, the goodness of the fit r, as well as the mean network area as a percentage of the magnetogram area are also registered within each plot. Derived linear fit coefficients (A,B) between free magnetic energy and heliographic plane network area are equal to (−2.89 × 1029, 4.33 × 1026), (− 2.53 × 1029, 9.39 × 1026), and (−2.21 × 1029, 1.42 × 1027) for the three network thresholds, while for relative magnetic helicity and heliographic plane network area they are equal to (−5.06 × 1037, 7.89 × 1035), (−5.63 × 1037, 2.31 × 1036), and (−6.53 × 1035, 3.54 × 1036).
Current usage metrics show cumulative count of Article Views (full-text article views including HTML views, PDF and ePub downloads, according to the available data) and Abstracts Views on Vision4Press platform.
Data correspond to usage on the plateform after 2015. The current usage metrics is available 48-96 hours after online publication and is updated daily on week days.
Initial download of the metrics may take a while.