Fig. 2
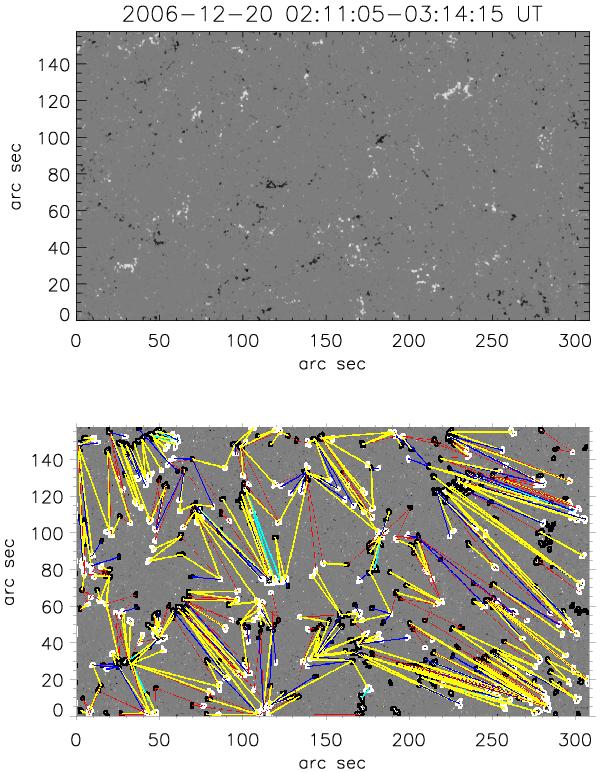
Top panel: an observed SOT/SP magnetogram (vertical field component Bz) of a quiet-Sun region studied here. White/black denotes positive/negative magnetic field concentrations. Bottom panel: inferred magnetic connectivity of the region, showing the vertical magnetic field component in grayscale with the contours bounding the identified magnetic partitions. The flux-tube connections identified by the magnetic connectivity matrix are represented by line segments connecting the flux-weighted centroids of the respective pair of partitions. Red, blue, yellow, and cyan segments denote magnetic flux contents within the ranges [1016, 1017] Mx, [1017, 1018] Mx, [1018, 1019] Mx, and >1019 Mx, respectively. Only connections closing within the field-of-view are shown.
Current usage metrics show cumulative count of Article Views (full-text article views including HTML views, PDF and ePub downloads, according to the available data) and Abstracts Views on Vision4Press platform.
Data correspond to usage on the plateform after 2015. The current usage metrics is available 48-96 hours after online publication and is updated daily on week days.
Initial download of the metrics may take a while.