Fig. 7
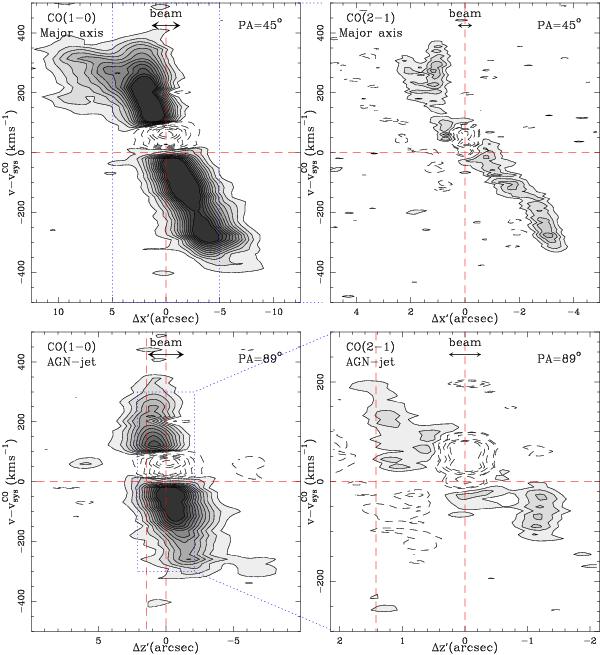
Position–velocity diagram of the 12CO(1-0) (left panels) and 12CO(2-1) (right panels) emission along the major axis of the molecular gas disk (top panels) and AGN-jet line (bottom panels) of 3C 293. Positions (Δz′) are relative to the AGN. Velocities are relative to the  . The contour levels are − 3σ, 3σ, to 36σ in steps of 3σ for the 12CO(1-0) diagrams and − 3σ, 3σ to 12σ in steps of 3σ for the 12CO(2-1) diagrams. 1σ = 0.9 and 1.7 mJy beam-1 for the 12CO(1-0) and 12CO(2-1) diagrams, respectively.
Current usage metrics show cumulative count of Article Views (full-text article views including HTML views, PDF and ePub downloads, according to the available data) and Abstracts Views on Vision4Press platform.
Data correspond to usage on the plateform after 2015. The current usage metrics is available 48-96 hours after online publication and is updated daily on week days.
Initial download of the metrics may take a while.