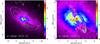
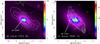
Fig. 4
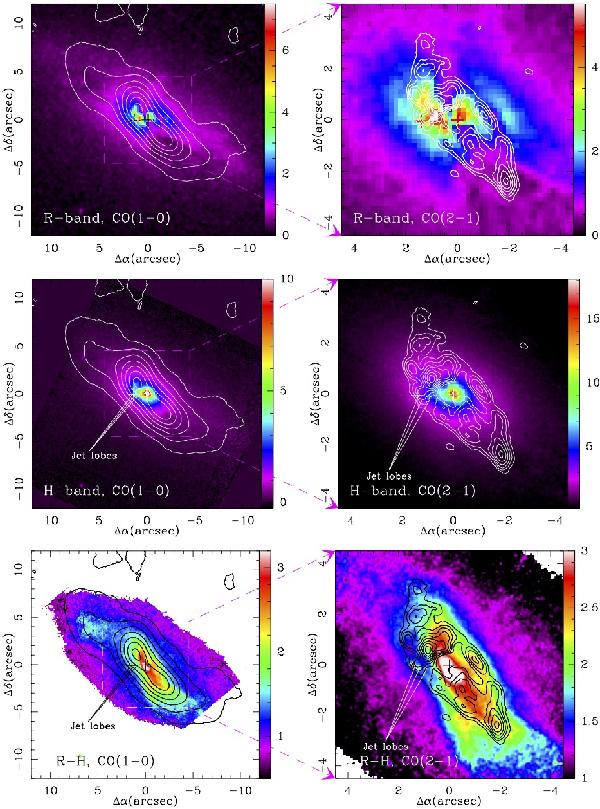
R-band (Martel et al. 1999), H-band (Floyd et al. 2006), and R–H (Floyd et al. 2006) images of 3C 293, with the 12CO(1-0) and 12CO(2-1) emissions overlaid. (Δα, Δδ)-offsets in arcsec are relative to the location of the AGN. Crosses (+) mark the position of the AGN and jet peak emission according to the UV-FIT models (Table 1). Solid lines mark the location of the IR counterparts of the Eastern radio lobe (Floyd et al. 2006). The dashed box in the 12CO(1-0) maps mark the size of the 12CO(2-1) maps shown in the right panel. Contour levels as in Fig. 3.
Current usage metrics show cumulative count of Article Views (full-text article views including HTML views, PDF and ePub downloads, according to the available data) and Abstracts Views on Vision4Press platform.
Data correspond to usage on the plateform after 2015. The current usage metrics is available 48-96 hours after online publication and is updated daily on week days.
Initial download of the metrics may take a while.