Fig. 2
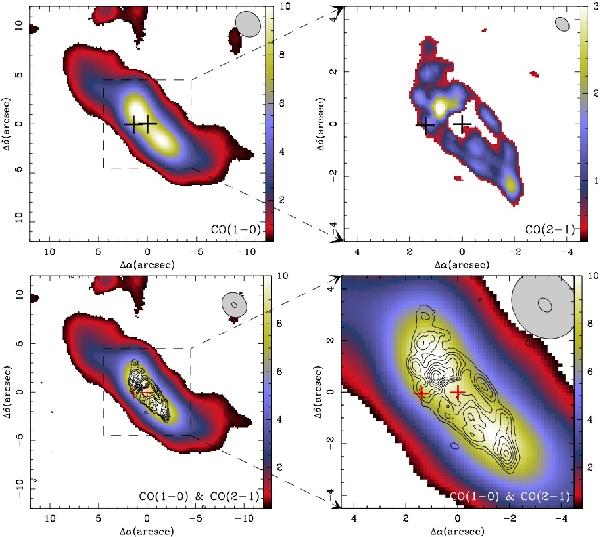
12CO(1-0) and 12CO(2-1) intensity maps of 3C 293, integrating all emission above 3σ levels, from v − vo = −380 to +500 km s-1 and v − vo = −280 to +450 km s-1 respectively. Crosses (+) mark the position of the AGN and jet peak emission according to the UV-FIT models (Table 1). The dashed box in the 12CO(1-0) map marks the size of the 12CO(2-1) map shown in the right panel. Color scales are in Jy beam -1 km s-1. The maps were clipped at 3σ, with σ = 0.11 and 0.13 Jy beam-1 km s-1 for the 12CO(1-0) and 12CO(2-1) maps, respectively. The bottom panels show an overlay of the 12CO(1-0) (color scale) and 12CO(2-1) (contours) emission above 3σ levels. The contour levels are 0.39 to 3.9 Jy beam-1 km s-1, in steps of 0.39 Jy beam-1 km s-1.
Current usage metrics show cumulative count of Article Views (full-text article views including HTML views, PDF and ePub downloads, according to the available data) and Abstracts Views on Vision4Press platform.
Data correspond to usage on the plateform after 2015. The current usage metrics is available 48-96 hours after online publication and is updated daily on week days.
Initial download of the metrics may take a while.