Fig. 11
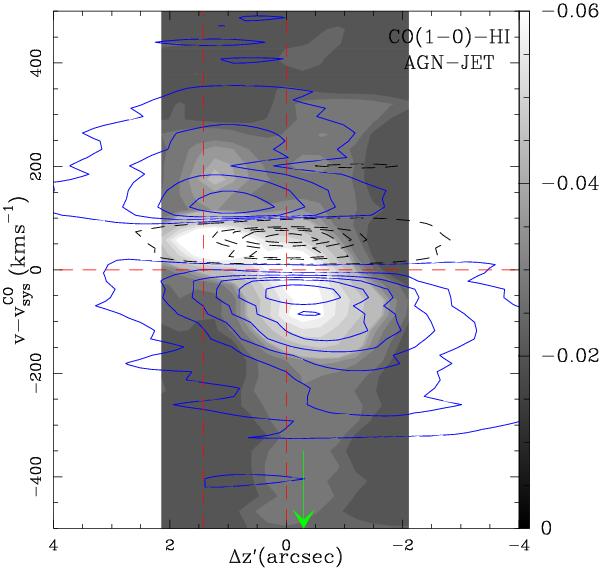
Overlay of the 12CO(1-0) (contours) and the H i (Fig. 1 from Mahony et al. 2013, gray scale) P − V diagrams along the AGN-jet line (PA = 89°). Positions (Δz′) are relative to the AGN. Velocities are relative to the  . The vertical red lines mark the coordinates of the AGN and jet detected at mm-wavelengths. The H i outflow component, seen against the western jet, reaches –900 km s-1. Its position is marked by the green arrow on the lower X axis.
Current usage metrics show cumulative count of Article Views (full-text article views including HTML views, PDF and ePub downloads, according to the available data) and Abstracts Views on Vision4Press platform.
Data correspond to usage on the plateform after 2015. The current usage metrics is available 48-96 hours after online publication and is updated daily on week days.
Initial download of the metrics may take a while.