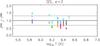
Fig. 10
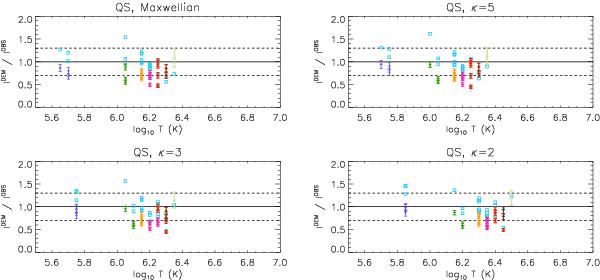
Calculated-to-observed intensities for the quiet Sun region, assuming Maxwellian distribution and κ-disribution with κ = 5, 3, and 2. Light blue squares are for W-S method. Color points with error bars are for RIM, and the color coding is the same as in the Fig. 9. Two horizontal dashed lines represent the error of observed intensities, which are at 30%.
Current usage metrics show cumulative count of Article Views (full-text article views including HTML views, PDF and ePub downloads, according to the available data) and Abstracts Views on Vision4Press platform.
Data correspond to usage on the plateform after 2015. The current usage metrics is available 48-96 hours after online publication and is updated daily on week days.
Initial download of the metrics may take a while.