Fig. 1
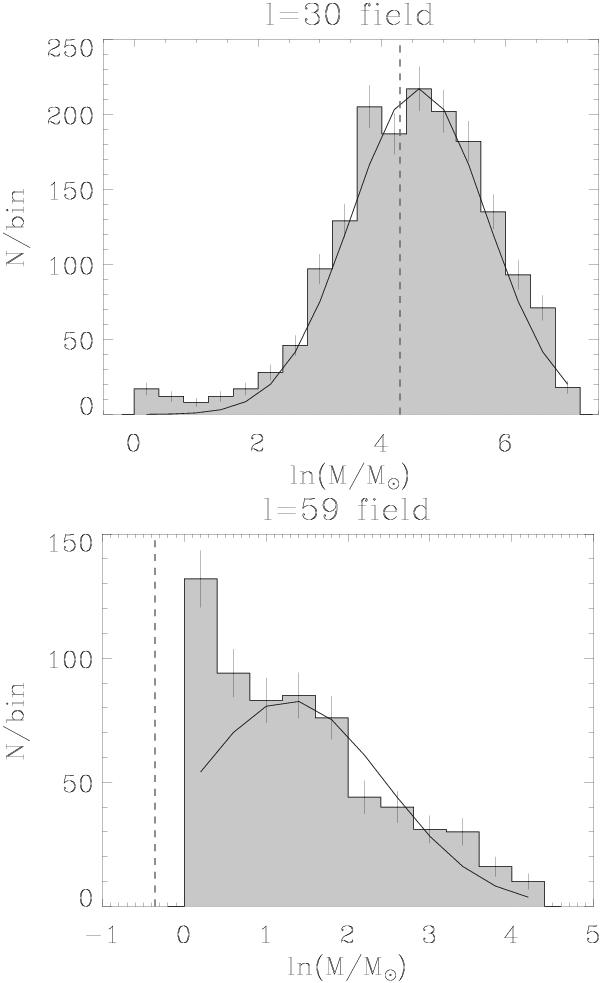
Distribution of ln(M) for the selected subset of clumps in the ℓ = 30° (top) and ℓ = 59° (bottom) fields. Vertical bars show Poisson errors. The solid lines show one realization of the posterior distributions (corresponding to the mean values obtained with the Metropolis-Hastings method, see Sect. 4.3) discussed in Sect. 5. The vertical dashed lines represent the completeness limits as described in Paper I.
Current usage metrics show cumulative count of Article Views (full-text article views including HTML views, PDF and ePub downloads, according to the available data) and Abstracts Views on Vision4Press platform.
Data correspond to usage on the plateform after 2015. The current usage metrics is available 48-96 hours after online publication and is updated daily on week days.
Initial download of the metrics may take a while.