Fig. 8
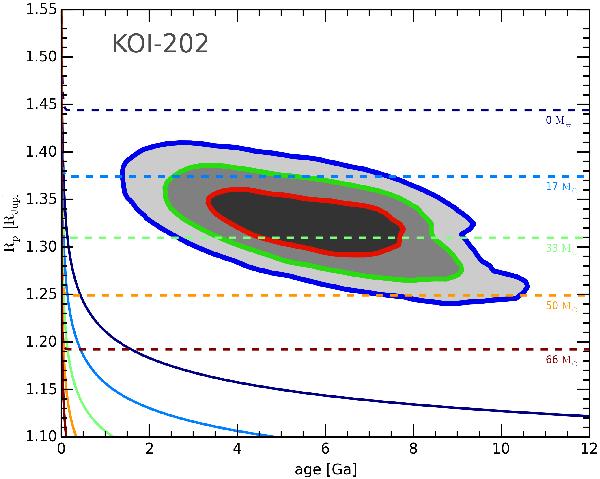
Evolution of Kepler-412b’s radius as a function of age. The 68.3%, 95.5% and 99.7% confidence regions are denoted by black, dark gray, and light gray areas respectively. The curves represent the thermal evolution of a 0.939 MJup planet with an equilibrium temperature of 1851 K. Text labels indicate the amount of heavy elements in the planet (its core mass in Earth masses). Dashed lines represent planetary evolution models for which 0.25% of the incoming stellar flux (about 1.789 × 1027 erg/s) is dissipated into the core of the planet, whereas full lines do not account for this dissipation (standard models).
Current usage metrics show cumulative count of Article Views (full-text article views including HTML views, PDF and ePub downloads, according to the available data) and Abstracts Views on Vision4Press platform.
Data correspond to usage on the plateform after 2015. The current usage metrics is available 48-96 hours after online publication and is updated daily on week days.
Initial download of the metrics may take a while.