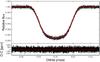
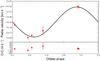
Fig. 3
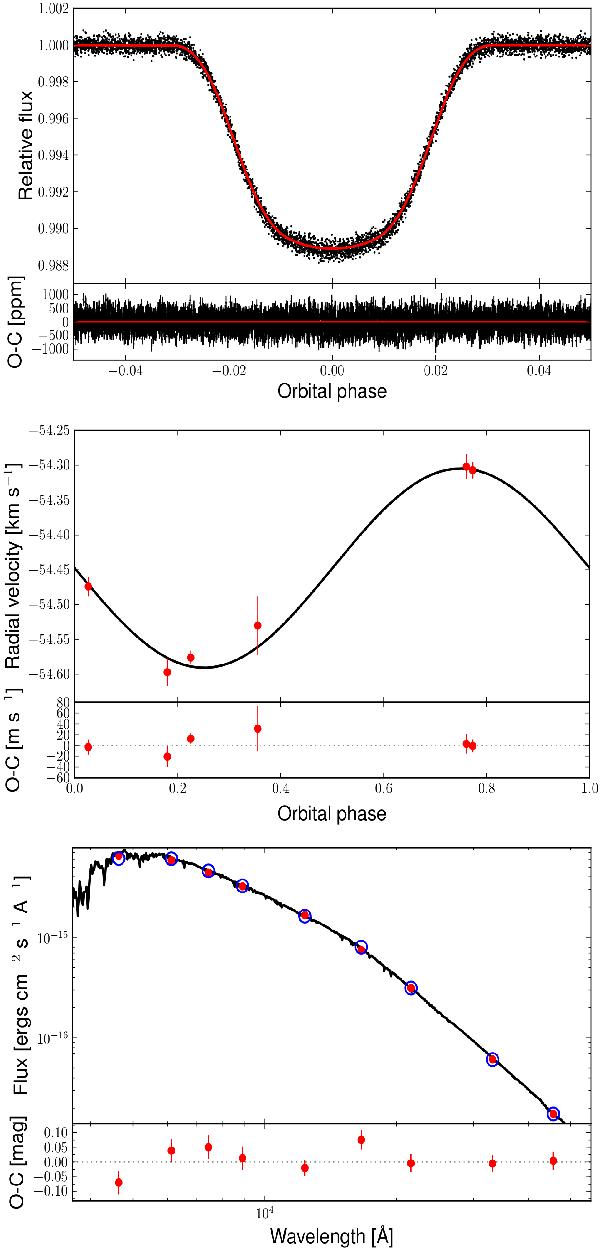
Top panel: best-fit model overplotted as a solid line to the phase-folded transit in the phase space. Black dots are long cadence individual points of Kepler-412b transit. Middle panel: phase-folded radial velocity measurements performed with SOPHIE. Bottom panel: flux integrated in each of the photometric band. The residuals are given at the bottom of each plot.
Current usage metrics show cumulative count of Article Views (full-text article views including HTML views, PDF and ePub downloads, according to the available data) and Abstracts Views on Vision4Press platform.
Data correspond to usage on the plateform after 2015. The current usage metrics is available 48-96 hours after online publication and is updated daily on week days.
Initial download of the metrics may take a while.