Free Access
Fig. 12
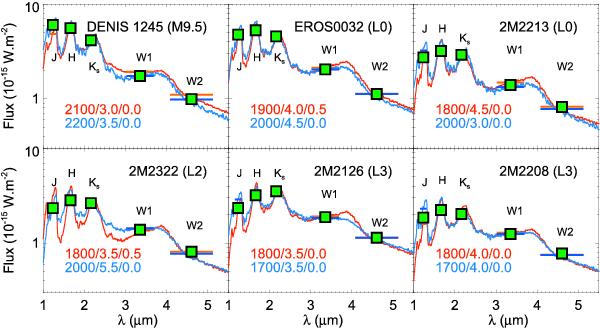
Fit of the spectral energy distribution of five sources of the target sample (green squares) without noticeable excess emission by BT-Settl 2010 (blue) and BT-Settl 2013 (red) synthetic fluxes (laying bars). The corresponding best-fit spectra are overlaid.
Current usage metrics show cumulative count of Article Views (full-text article views including HTML views, PDF and ePub downloads, according to the available data) and Abstracts Views on Vision4Press platform.
Data correspond to usage on the plateform after 2015. The current usage metrics is available 48-96 hours after online publication and is updated daily on week days.
Initial download of the metrics may take a while.