Fig. 5
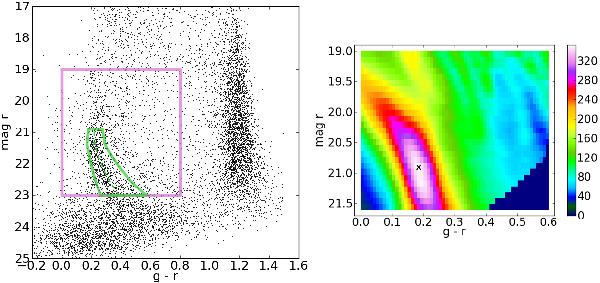
Left: dereddened CMD (black dots) with the search region (pink solid-line rectangle) for the cross-correlation and the template main sequence-shaped function (green solid line) at the position of maximum density (peak of the cross-correlation). Right: binned diagram representing the weighted density of stars resulting from the cross-correlation process. The density in each bin corresponds to the integral of the template main sequence-shaped function with top left corner in the position of the bin.
Current usage metrics show cumulative count of Article Views (full-text article views including HTML views, PDF and ePub downloads, according to the available data) and Abstracts Views on Vision4Press platform.
Data correspond to usage on the plateform after 2015. The current usage metrics is available 48-96 hours after online publication and is updated daily on week days.
Initial download of the metrics may take a while.