Fig. 13
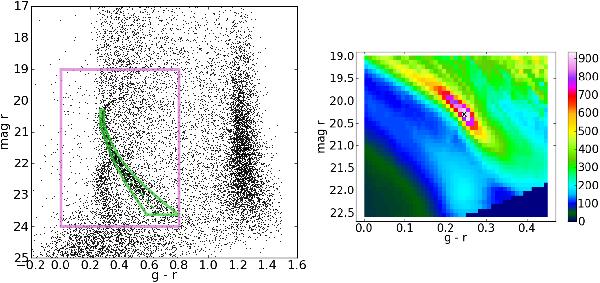
Left: dereddened CMD for the pointing containing the Palomar 5 stream as its primary feature; the template main sequence function and the turnoff point (green) are plotted for the maximum of the cross-correlation. The secondary main sequence at fainter magnitudes corresponds to the faint arm of the Sgr stream. Right: weighted-density diagram resulting from the cross-correlation. The maximum (white bin, black cross) marks the top left corner of the template-MS function at the position of the Palomar 5 stream’s main sequence, whereas the cyan overdensity at fainter magnitudes corresponds to the Sgr stream.
Current usage metrics show cumulative count of Article Views (full-text article views including HTML views, PDF and ePub downloads, according to the available data) and Abstracts Views on Vision4Press platform.
Data correspond to usage on the plateform after 2015. The current usage metrics is available 48-96 hours after online publication and is updated daily on week days.
Initial download of the metrics may take a while.