Free Access
Fig. 8
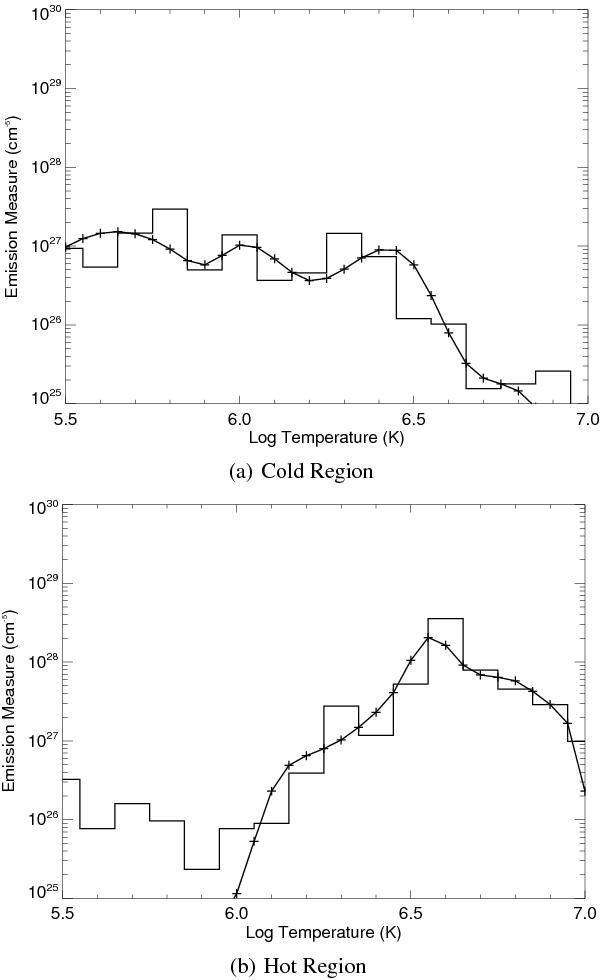
Best DEM solutions from MCMC method (histogram, red in Fig. 6) and from the Del Zanna method (solid line + symbols) for a) the cold and b) the hot region. The emission measure values with MCMC are divided by the temperature to match the output from the Del Zanna method.
This figure is made of several images, please see below:
Current usage metrics show cumulative count of Article Views (full-text article views including HTML views, PDF and ePub downloads, according to the available data) and Abstracts Views on Vision4Press platform.
Data correspond to usage on the plateform after 2015. The current usage metrics is available 48-96 hours after online publication and is updated daily on week days.
Initial download of the metrics may take a while.