Fig. 6
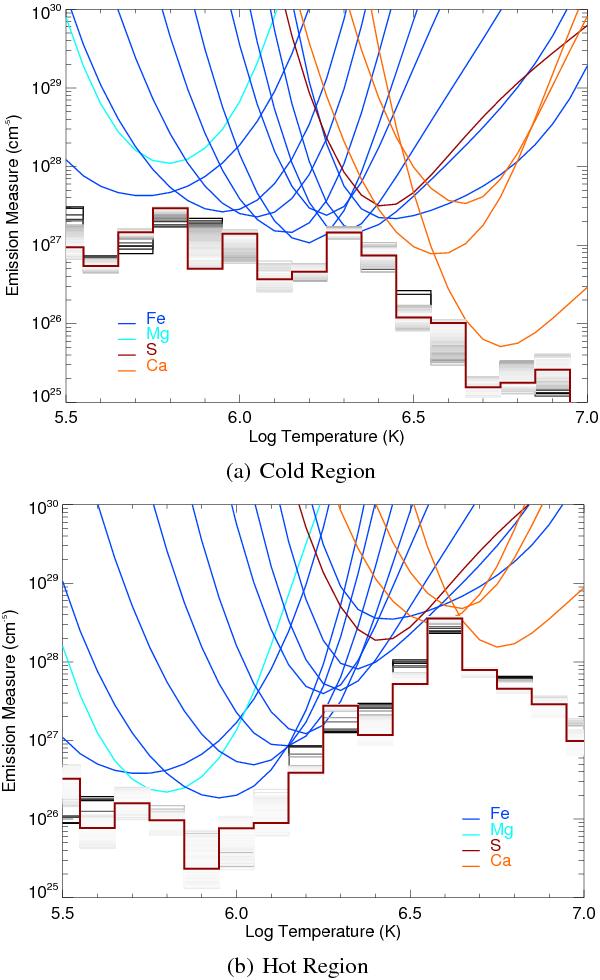
Results of DEM reconstruction using the MCMC technique on 14 Hinode/EIS line fluxes (see text, and Table 1) for a) the cold region, b) the hot region, shown in Fig. 2. The red (histogram) curve is the solution that better reproduces the observed fluxes, the histogram cloud contains the solutions. The EM-loci curves are also shown for reference, each colour marks a different element.
Current usage metrics show cumulative count of Article Views (full-text article views including HTML views, PDF and ePub downloads, according to the available data) and Abstracts Views on Vision4Press platform.
Data correspond to usage on the plateform after 2015. The current usage metrics is available 48-96 hours after online publication and is updated daily on week days.
Initial download of the metrics may take a while.