Fig. 9
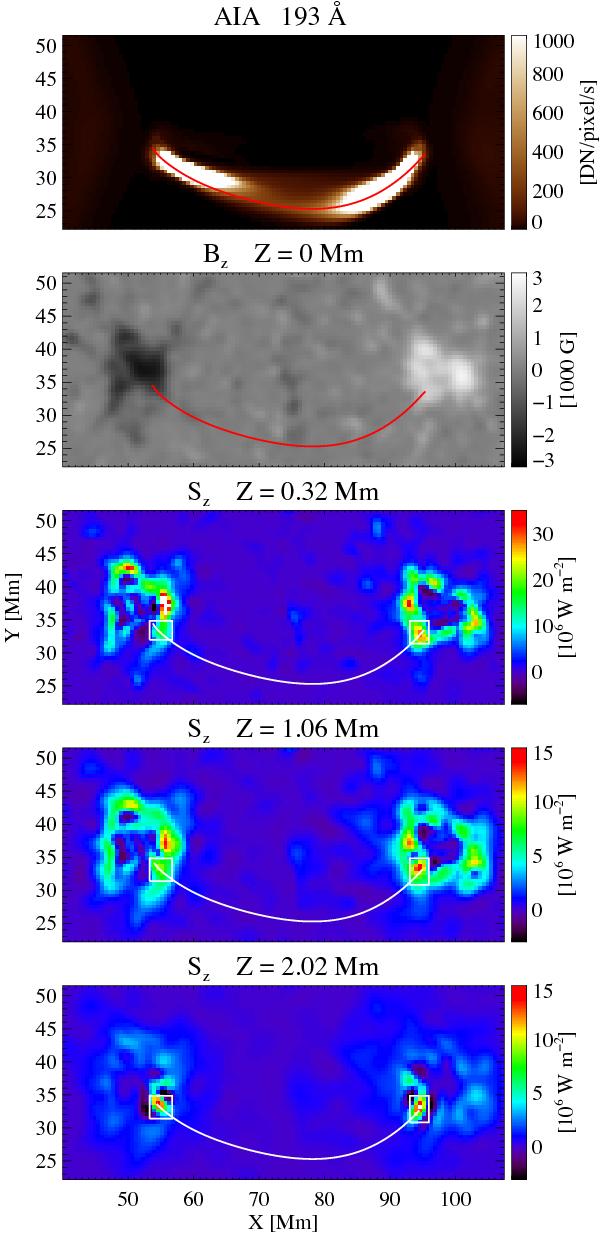
Zoom into the emerging active region at t = 14 min. The top two panels show the synthesized AIA 193 Å emission integrated along the vertical and the magnetic field, Bz, at the bottom boundary. The lower three panels show the vertical component of the Poynting flux, Sz, at three heights. The red and white lines indicate the same magnetic fieldline at the spine of the loop as shown in Figs. 2. The white boxes around both footpoints in the lower panels indicate the regions where we calculate the average vertical Poynting flux in Fig. 10.
Current usage metrics show cumulative count of Article Views (full-text article views including HTML views, PDF and ePub downloads, according to the available data) and Abstracts Views on Vision4Press platform.
Data correspond to usage on the plateform after 2015. The current usage metrics is available 48-96 hours after online publication and is updated daily on week days.
Initial download of the metrics may take a while.