Fig. 8
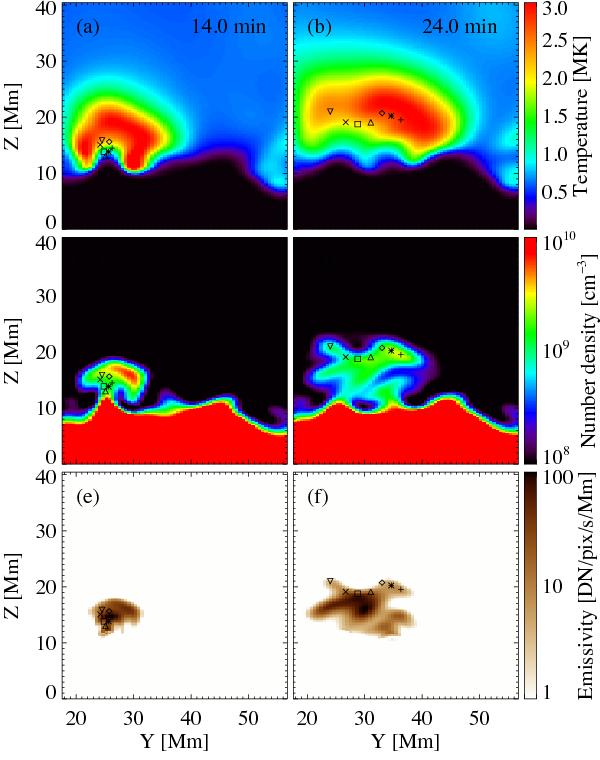
Temperature, density and synthesized AIA 193 Å emission in a vertical midplane between the loop footpoints (cut at x = 73 Mm). The left and right columns show snapshots 10 min apart at the times indicated in the top panels. In the temperature plots green roughly represents the temperature of maximum contribution to the 193 Å channel. The black symbols indicate the cross section of the magnetic tube discussed in Sect. 5.1 and Fig. 7. The field of view roughly matches the black square in dashed line in Fig. 6. See Sect. 5.2.
Current usage metrics show cumulative count of Article Views (full-text article views including HTML views, PDF and ePub downloads, according to the available data) and Abstracts Views on Vision4Press platform.
Data correspond to usage on the plateform after 2015. The current usage metrics is available 48-96 hours after online publication and is updated daily on week days.
Initial download of the metrics may take a while.