Fig. 7
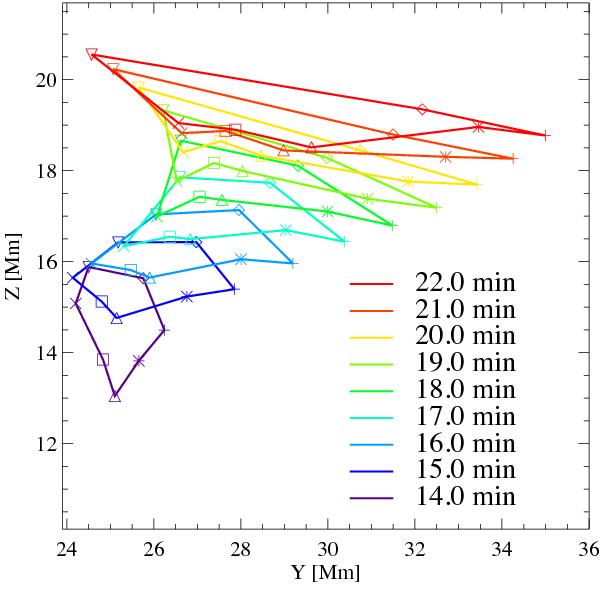
Evolution of cross section of the magnetic tube roughly encompassing the loop appearing in the synthesized AIA 193 Å images (cf. Fig. 2). The symbols show the positions of the fieldlines used to define the magnetic tube in the vertical midplane between the loop footpoints (cf. green square in Fig. 6). The same symbols indicate the same fieldline at the times color-coded according to the key. See Sect. 5.1.
Current usage metrics show cumulative count of Article Views (full-text article views including HTML views, PDF and ePub downloads, according to the available data) and Abstracts Views on Vision4Press platform.
Data correspond to usage on the plateform after 2015. The current usage metrics is available 48-96 hours after online publication and is updated daily on week days.
Initial download of the metrics may take a while.