Fig. 6
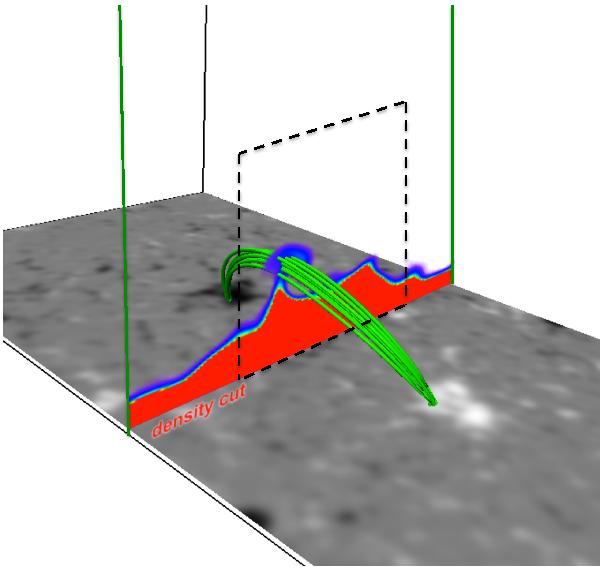
3D visualization of the location of the bright loop at time t = 14 min. The green lines show the fieldlines roughly outlining the volume of the first bright loop appearing in the simulation. The bottom plane shows the vertical component of the photospheric magnetic field. A density cut in the vertical plane halfway between the footpoints of the loops perpendicular to the loop is indicated by the large green square. On this cut red indicates chromospheric densities, and blue enhanced coronal densities of about 109 cm-3. Lower densities in the corona are transparent. The black square in dashed line on the midplane indicates the field of view in Fig. 8. See Sect. 5.
Current usage metrics show cumulative count of Article Views (full-text article views including HTML views, PDF and ePub downloads, according to the available data) and Abstracts Views on Vision4Press platform.
Data correspond to usage on the plateform after 2015. The current usage metrics is available 48-96 hours after online publication and is updated daily on week days.
Initial download of the metrics may take a while.