Fig. 4
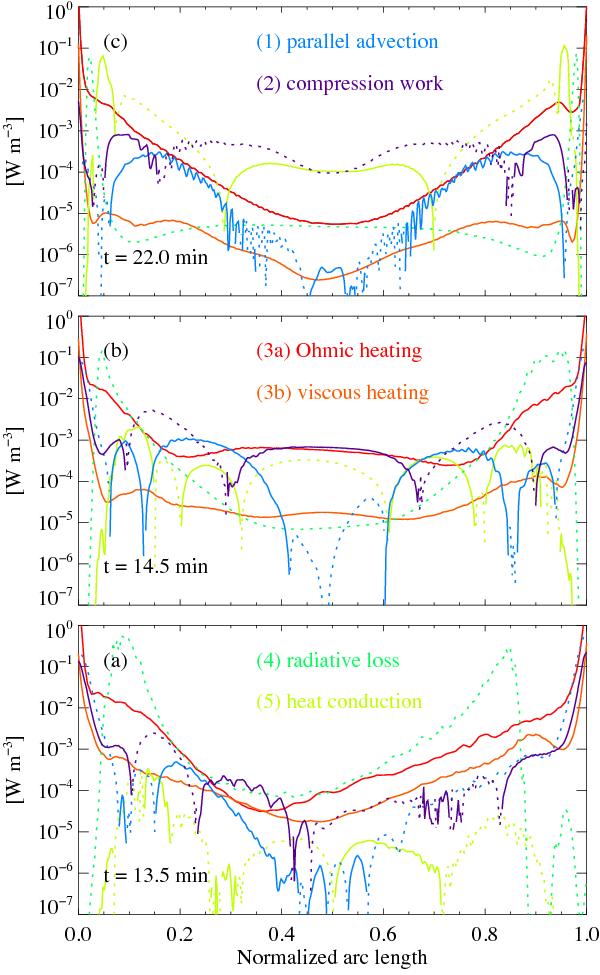
Energy budget along the loop at three different times. The panels show snapshots during the phases of initiation a), formation b), and cooling c) at the time given in each panel. These times are indicated to the right of Fig. 3d by the marks 4a, 4b, and 4c. The terms in Eq. (1) are shown accordingly to the labels in the plots, the numbers correspondingly to those in Eq. (1). The line colors follow the same definition in all panels. Dashed lines indicate negative, solid lines positive values. The arc lengths are normalized, with 0 and 1 corresponding to the two footpoints of the fieldline in the photosphere. See Sect. 4.2.
Current usage metrics show cumulative count of Article Views (full-text article views including HTML views, PDF and ePub downloads, according to the available data) and Abstracts Views on Vision4Press platform.
Data correspond to usage on the plateform after 2015. The current usage metrics is available 48-96 hours after online publication and is updated daily on week days.
Initial download of the metrics may take a while.