Fig. 3
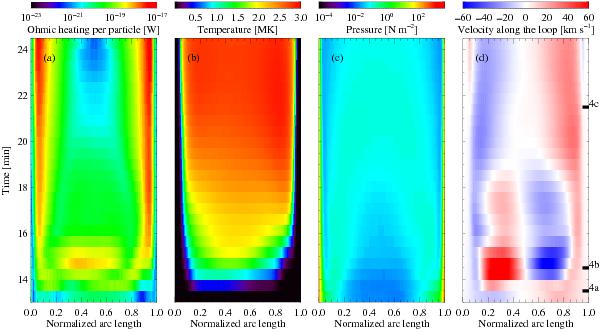
Space–time diagram of emerging loop. All properties are shown as functions of normalized arc length along the fieldline at the spine of the forming loop and time. Because the fieldline is followed in time, its length is changing and the arc length along the fieldline is normalized to the length at the respective time. The loop footpoints are at arclengths 0 and 1. In the velocity plot positive velocities (red) indicate a flow in the direction of arc lengths from 0 to 1 (“to the right”). In the color scale for the temperature green roughly corresponds to the peak contribution to the AIA 193 Å channel. The marks 4a, 4b, and 4c in the right panel indicate the times shown in the three panels of Fig. 4. See Sect. 4.1.
Current usage metrics show cumulative count of Article Views (full-text article views including HTML views, PDF and ePub downloads, according to the available data) and Abstracts Views on Vision4Press platform.
Data correspond to usage on the plateform after 2015. The current usage metrics is available 48-96 hours after online publication and is updated daily on week days.
Initial download of the metrics may take a while.