Fig. 2
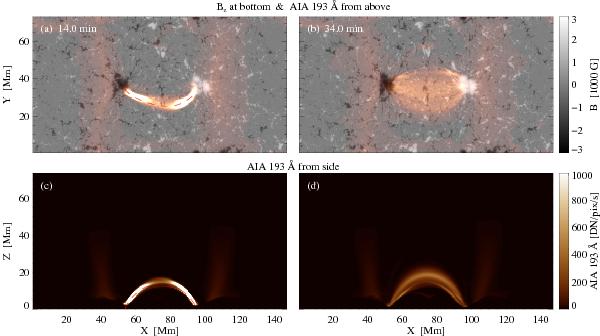
Evolution of synthesized coronal emission and magnetic field. The top panels show photospheric magnetograms (vertical component), overlaid with the synthesized coronal emission as it would be seen in the AIA 193 Å channel. The bottom panels show synthesized AIA 193 Å images as seen from the side. The synthetic emission is integrated along the line of sight, comparable to what is seen at the disk center (top) or the limb (bottom). The two columns show snapshots from the simulation 20 min apart. Times refer to 25.5 h after the start of the flux-emergence simulation. The dashed line in the left panels shows the fieldline at the spine of the loop selected for the analysis in Sect. 4. An animation of the figure is available online.
Current usage metrics show cumulative count of Article Views (full-text article views including HTML views, PDF and ePub downloads, according to the available data) and Abstracts Views on Vision4Press platform.
Data correspond to usage on the plateform after 2015. The current usage metrics is available 48-96 hours after online publication and is updated daily on week days.
Initial download of the metrics may take a while.