Fig. 10
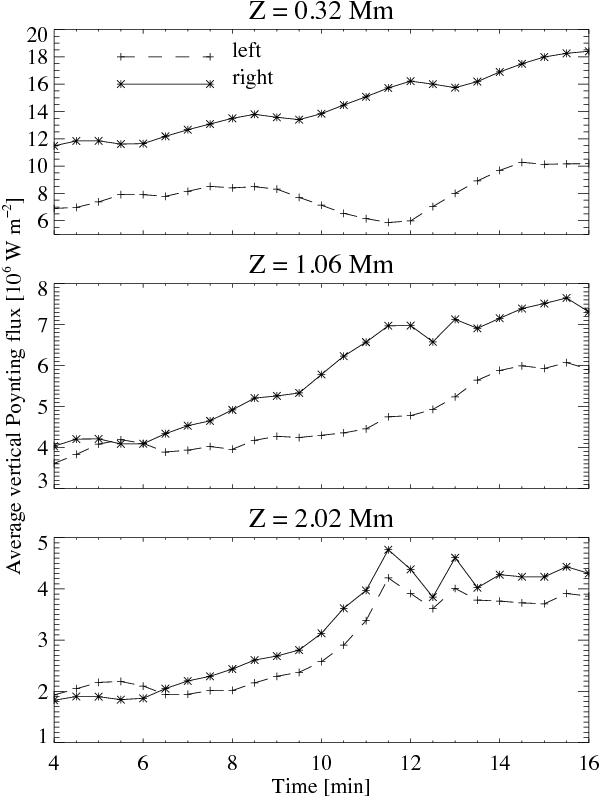
Temporal evolution of the vertical Poynting flux at the loop footpoints at three different heights from the surface (top panel) to the coronal base (bottom panel). Here we show the averages in horizontal regions around the fieldline indicated in Fig. 9 by the respective boxes. The dashed lines are for the left footpoint, and solid lines are for the right footpoint.
Current usage metrics show cumulative count of Article Views (full-text article views including HTML views, PDF and ePub downloads, according to the available data) and Abstracts Views on Vision4Press platform.
Data correspond to usage on the plateform after 2015. The current usage metrics is available 48-96 hours after online publication and is updated daily on week days.
Initial download of the metrics may take a while.