Fig. 1
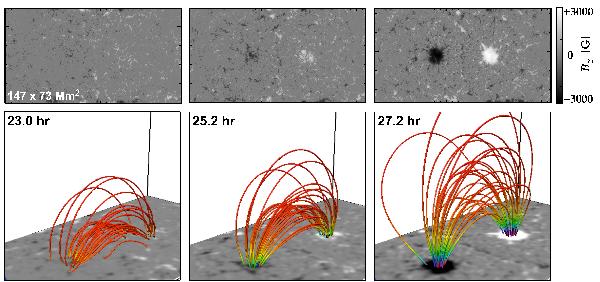
Overview of the evolution of the magnetic field. The top row shows the magnetogram at the bottom boundary in the photosphere at three different times (vertical magnetic field). The horizontal extent in the top panels is 147.5 × 73.7 Mm2. The bottom row shows the evolution of a group of magnetic fieldlines in the coronal model driven by the flux emergence. The color coding on the fieldlines shows the magnetic field strength (red is low and purple is high). The bottom of the 3D rendering boxes are the same magnetogram as the top row. The times in the panels refer to the time since the start of the flux-emergence simulation. See Sect. 3.1.
Current usage metrics show cumulative count of Article Views (full-text article views including HTML views, PDF and ePub downloads, according to the available data) and Abstracts Views on Vision4Press platform.
Data correspond to usage on the plateform after 2015. The current usage metrics is available 48-96 hours after online publication and is updated daily on week days.
Initial download of the metrics may take a while.