Fig. 5
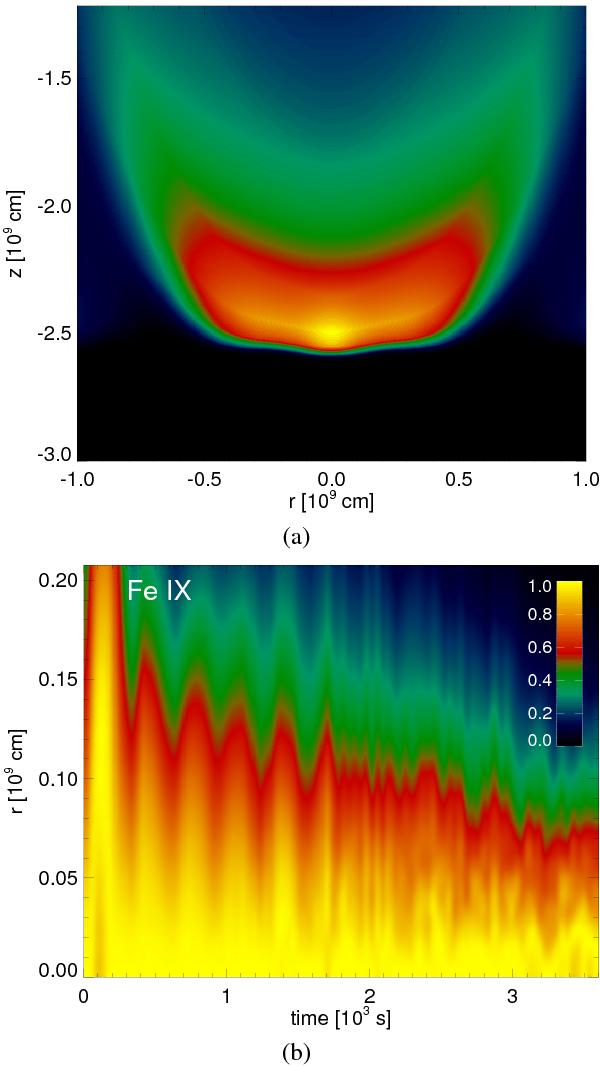
a) Synthetic emission in the Fe IX 171 Å line at t = 0, in the same enlargement as in Fig. 4. The emission is normalized to its maximum and the color scale is shown in panel b). b) Time–space plot of the synthetic emission in the Fe IX 171 Å line. We plot the radial profile of the emission in the vertical direction at all times. Each profile is normalized to its maximum.
Current usage metrics show cumulative count of Article Views (full-text article views including HTML views, PDF and ePub downloads, according to the available data) and Abstracts Views on Vision4Press platform.
Data correspond to usage on the plateform after 2015. The current usage metrics is available 48-96 hours after online publication and is updated daily on week days.
Initial download of the metrics may take a while.