Fig. 2
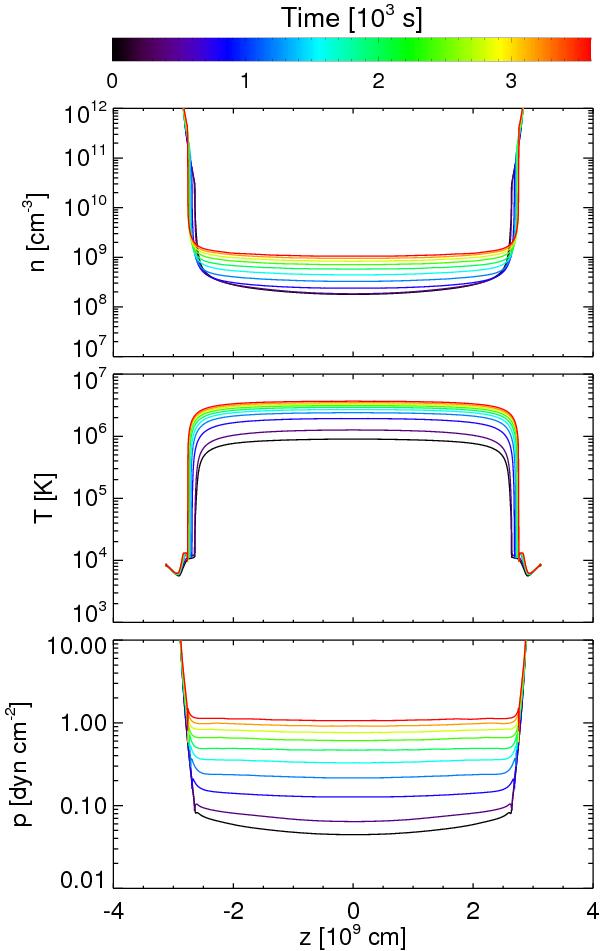
Evolution of the density, temperature, and pressure profiles along the loop central axis (r = 0) in logarithmic scale after the time-dependent heating is switched on. Different line colors mark different times, from black (early) to red (late). The profiles are sampled regularly with a cadence of ≈400 s.
Current usage metrics show cumulative count of Article Views (full-text article views including HTML views, PDF and ePub downloads, according to the available data) and Abstracts Views on Vision4Press platform.
Data correspond to usage on the plateform after 2015. The current usage metrics is available 48-96 hours after online publication and is updated daily on week days.
Initial download of the metrics may take a while.