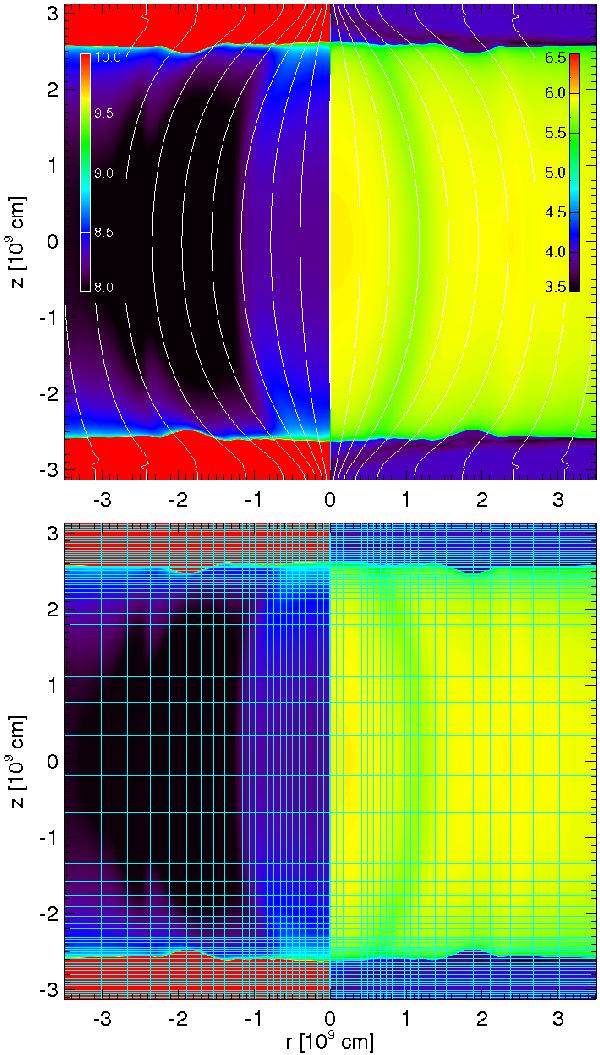
Fig. 1

Top: color maps in logarithmic scale of density (left, [cm-3]) and temperature (right, [K]) before the loop heating is switched on. The chromosphere is red in the density map and blue in the temperature map. The magnetic field lines are also marked (white lines). Bottom: pixel map in the computational domain. Each box encloses 10 × 10 grid points.
Current usage metrics show cumulative count of Article Views (full-text article views including HTML views, PDF and ePub downloads, according to the available data) and Abstracts Views on Vision4Press platform.
Data correspond to usage on the plateform after 2015. The current usage metrics is available 48-96 hours after online publication and is updated daily on week days.
Initial download of the metrics may take a while.


