Fig. 9
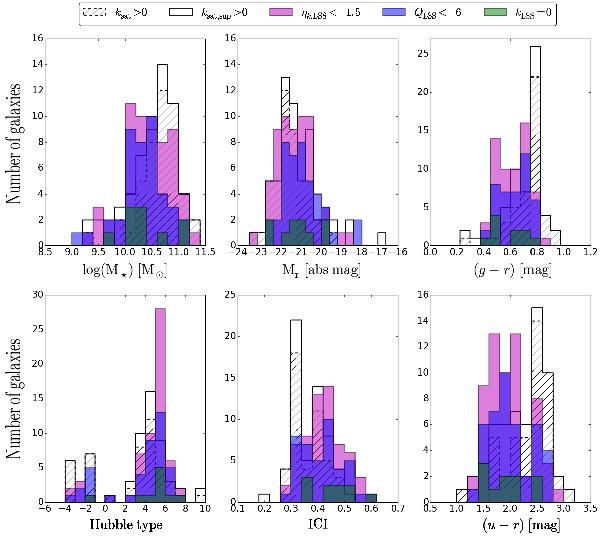
Distributions of the stellar mass (upper left panel), r-band absolute magnitude (upper central panel), (g − r) rest-frame colour (upper right panel), morphological Hubble type (T) according to Fernández Lorenzo et al. (2012) (lower left panel), inverse concentration index (lower central panel), and (u − r) rest-frame colour (lower right panel) for CIG galaxies. The distributions for the 10 most isolated CIG galaxies are represented by green histograms, and the most isolated CIG galaxies in terms of projected density ηk,LSS and tidal strength QLSS are represented by magenta and blue histograms, respectively. In contrast, distributions for CIG galaxies with satellites are represented by white histograms (hatched histograms for the escape-speed selection and plain white histograms for upper-limit selection of satellites).
Current usage metrics show cumulative count of Article Views (full-text article views including HTML views, PDF and ePub downloads, according to the available data) and Abstracts Views on Vision4Press platform.
Data correspond to usage on the plateform after 2015. The current usage metrics is available 48-96 hours after online publication and is updated daily on week days.
Initial download of the metrics may take a while.