Fig. 6
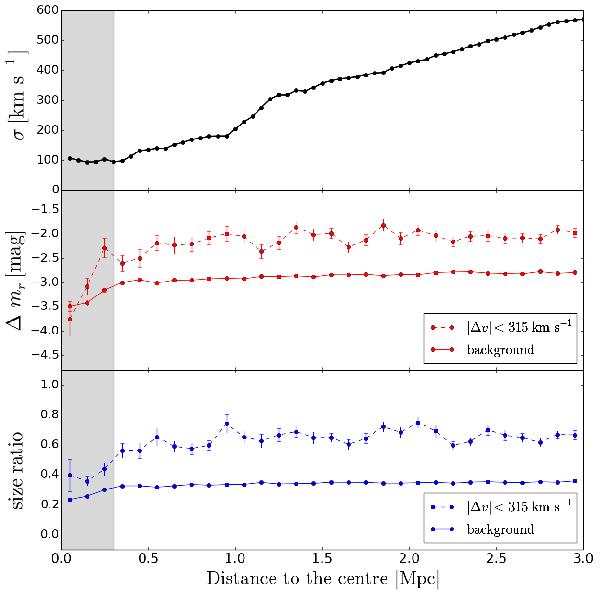
Upper panel: standard deviation σ of the Gaussian distribution fitting for | Δ ν | as a function of the distance to the central galaxy. Middle panel: magnitude difference ( between neighbour i and its corresponding primary CIG galaxy P) for satellites (| Δ ν | ≤ 315 km s-1, red dashed line) and for background galaxies (315 < | Δ ν | < 3000 km s-1, red solid line) as a function of the distance to the central CIG galaxy. Lower panel: size ratio (
 between neighbour i and its corresponding primary CIG galaxy P) for satellites (| Δ ν | ≤ 315 km s-1, blue dashed line) and for the background population (315 < | Δ ν | < 3000 km s-1, blue solid line) as a function of the distance to the central CIG galaxy. The inner 0.3 Mpc are shaded in the three panels.
Current usage metrics show cumulative count of Article Views (full-text article views including HTML views, PDF and ePub downloads, according to the available data) and Abstracts Views on Vision4Press platform.
Data correspond to usage on the plateform after 2015. The current usage metrics is available 48-96 hours after online publication and is updated daily on week days.
Initial download of the metrics may take a while.