Fig. 4
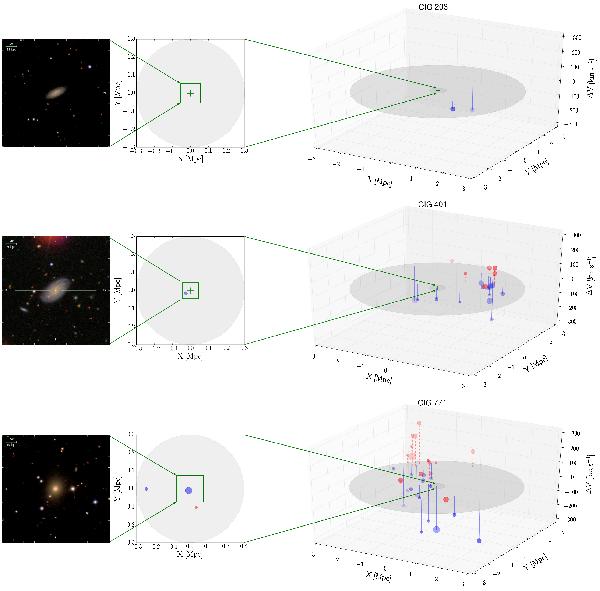
SDSS three-colour images (left, with a field of view of 3′3, north is up, east is to the left), representation in 2D (centre, with a field of view of 0.6 Mpc, north is up, east is to the left), and representation in 3D (right, with a field of view of 6 Mpc) of the environment of the galaxies CIG 203 (upper panel), CIG 401 (middle panel), and CIG 771 (lower panel). The central green pluses correspond to the locations of the primary CIG galaxies. Grey disks at 0.3 and 3 Mpc boundaries represent the areas in which we studied the local environment and the LSS, respectively. The sizes of the symbols are proportional to the diameters of the neighbours (not at scale), in red or blue according to blueshift or redshift of the neighbours. Vertical lines indicate the projection of the neighbours in the 2D plane. Solid green lines indicate the scale relations between the three different representations.
Current usage metrics show cumulative count of Article Views (full-text article views including HTML views, PDF and ePub downloads, according to the available data) and Abstracts Views on Vision4Press platform.
Data correspond to usage on the plateform after 2015. The current usage metrics is available 48-96 hours after online publication and is updated daily on week days.
Initial download of the metrics may take a while.