Fig. 3
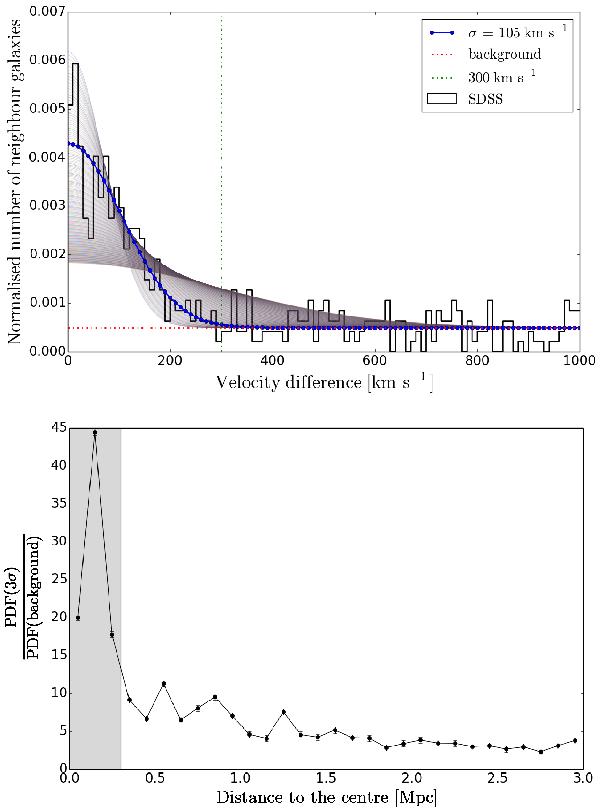
Upper panel: absolute values of the line-of-sight velocity difference between neighbours and the central CIG galaxy: | Δ ν | distribution obtained by stacking 411 CIG fields within 1 Mpc field radius (black histogram), and corresponding Gaussian distribution fits for σ between 70 and 300 km s-1 (grey curves) with the best fit (blue curve). The Gaussian fit has been made within | Δ ν | = 300 km s-1 (vertical line) and considering the flat continuum distribution of background neighbours as a zero point (horizontal line). Lower panel: probability density function (PDF) for neighbour galaxies peaking at | Δ ν | = 0 km s-1 over PDF for the background flat population selected in the interval 1000 < | Δ ν | < 3000 km s-1, as a function of the distance to the central CIG galaxy. The inner 0.3 Mpc are shaded.
Current usage metrics show cumulative count of Article Views (full-text article views including HTML views, PDF and ePub downloads, according to the available data) and Abstracts Views on Vision4Press platform.
Data correspond to usage on the plateform after 2015. The current usage metrics is available 48-96 hours after online publication and is updated daily on week days.
Initial download of the metrics may take a while.