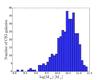
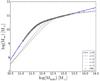
Fig. 1
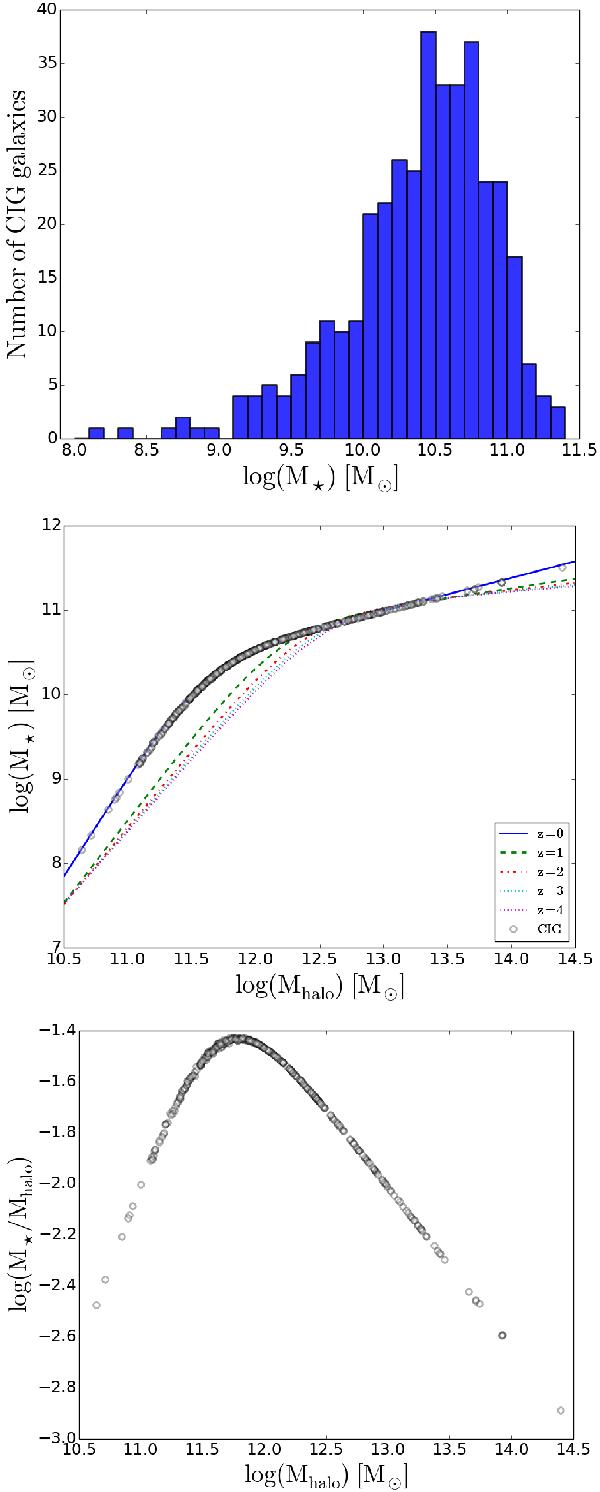
Upper panel: distribution of the stellar masses of the CIG galaxies. Middle panel: SHM relation for central galaxies as a function of redshift (Fig. 5 in Moster et al. 2013). Blue solid line, green dashed line, red point-dashed line, cyan pointed line, and magenta pointed line correspond to the SHM relation at redshift 0, 1, 2, 3, and 4, respectively. Black circles correspond to the parametrisation of the SHM relation for CIG galaxies. Lower panel: logarithm of the SHM ratio for CIG galaxies.
Current usage metrics show cumulative count of Article Views (full-text article views including HTML views, PDF and ePub downloads, according to the available data) and Abstracts Views on Vision4Press platform.
Data correspond to usage on the plateform after 2015. The current usage metrics is available 48-96 hours after online publication and is updated daily on week days.
Initial download of the metrics may take a while.