Fig. 3
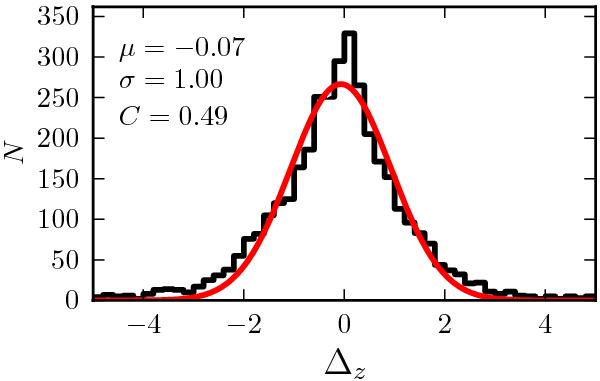
Distribution of the variable Δz for the 3813 galaxies in the ALHAMBRA area with i ≤ 22.5 and a measured spectroscopic redshift. The red line is the best least-squares fit of a Gaussian function to the data. The median, dispersion, and the factor C derived from the fit are labelled in the panel. A colour version of this plot is available in the electronic edition.
Current usage metrics show cumulative count of Article Views (full-text article views including HTML views, PDF and ePub downloads, according to the available data) and Abstracts Views on Vision4Press platform.
Data correspond to usage on the plateform after 2015. The current usage metrics is available 48-96 hours after online publication and is updated daily on week days.
Initial download of the metrics may take a while.